All Over the Map — The Imprecision of 24 California HERS Ratings
A home energy rating is supposed to tell you how energy efficient your home is. A certified home energy rater goes to the home and collects all the data relevant to energy consumption in the home (well, all the data included in the rating anyway, which is almost everything). Then they enter the data into energy modeling software and get the results: consumption for heating, cooling, water heating, lights, and appliances plus this thing called a HERS Index. But what if the results were off by 50%, 100%, or even more?
A home energy rating is supposed to tell you how energy efficient your home is. A certified home energy rater goes to the home and collects all the data relevant to energy consumption in the home (well, all the data included in the rating anyway, which is almost everything). Then they enter the data into energy modeling software and get the results: consumption for heating, cooling, water heating, lights, and appliances plus this thing called a HERS Index. But what if the results were off by 50%, 100%, or even more?
That’s exactly what a new study in California has found. In the same project I wrote about earlier this year (Stockton Project Demonstrates Huge Home Energy Savings), researchers John Proctor, Rick Chitwood, and Bruce Wilcox hired 6 California HERS raters to rate the four homes in the study. Here’s a quick description of the homes:
| House | Year Built | Size |
| Caleb | 2005 | 2076 sf |
| Fidelia | 1990 | 1690 sf |
| Mayfair | 1953 | 1104 sf |
| Grange | 1948 | 852 sf |
The envelope, please
The study, titled Round Robin HERS Ratings of Four California Homes: A Central Valley Research Homes Project, was published in May 2014 and shows the data from the raters they hired to rate each home. And who did those ratings? Before they did any work on the homes, the researchers hired six HERS raters using the California HERS protocols. All used the energy modeling software Energy Pro version 5.1.6.7.
Here’s the summary table of the main results:
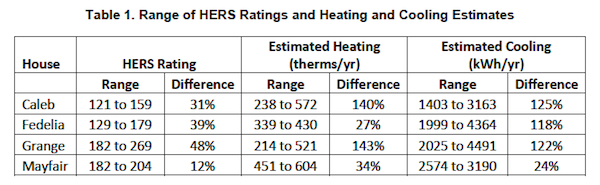
The second and third columns, labeled HERS Rating, show the range of HERS Index values calculated by the six raters and the percent difference between the highest and lowest. Only one of the homes (Mayfair) comes close to having an acceptable variation among raters. Even that 12%, however, is four times as much as RESNET allows in the field QA process for raters. The heating and cooling consumption are also shown, and the spread is even worse.
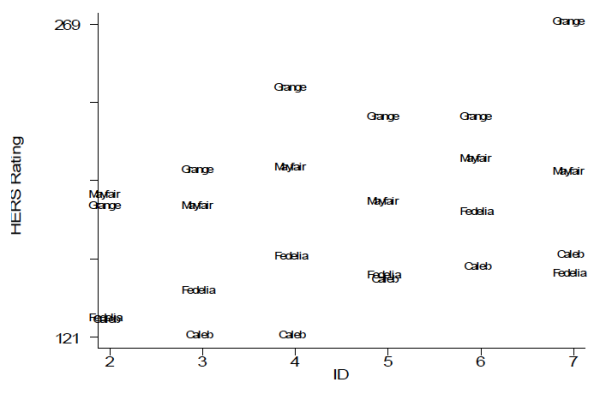
The graph below shows each rater’s HERS Indices for the four houses. The vertical scale is the Index and the horizontal scale shows the raters by ID numbers. The Grange and Mayfair homes, being the two oldest, have the highest HERS Indices for all six raters with the Grange being the highest of all four homes for five of the six raters.
Why so much variation?
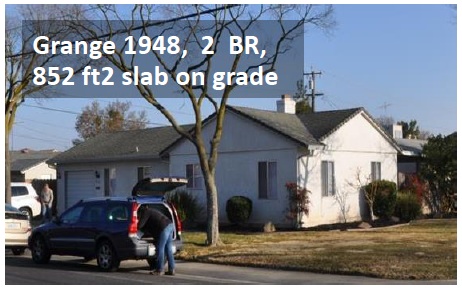
Strangely, the smallest, simplest house had the most HERS Index variation among the six raters. The home the researchers called the Grange, shown in the photo at the beginning of this article, has only 852 square feet of conditioned floor area. It also has the simplest type of foundation to enter (slab on grade) and none of the complicating factors like attic kneewalls, vaulted ceilings, or sealed attics that can make some houses difficult to rate. It’s just a simple, little box.
Despite the simplicity, however, the HERS Index for this home ranged from a low of 182 to a high of 269, a difference of 48%. One of the problems seems to have been the raters’ inability to agree on the efficiency of the air conditioner. The six raters used SEER ratings of 8, 10, 11, and 12, a difference of 50%.
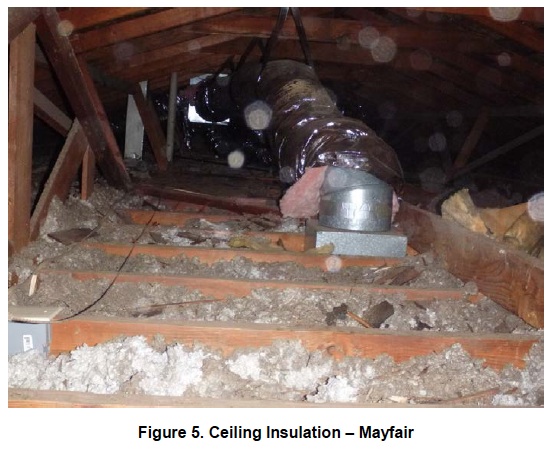
Another problem with accuracy was attic insulation. The researchers reported that the Mayfair, the second smallest and oldest of the homes, had an average of about one inch of insulation on top of the ceiling, as shown in the photo below. That would result in an R-value of about 3 or 4, yet three of the HERS raters entered that ceiling as being insulated to R-11. In the Fidelia home, the ceiling insulation entries varied from R-19 to R-49.
Accuracy versus precision
In their initial report on the HERS ratings, the researchers did not include a comparison of the raters’ results to the measured results from the study. This is a three-year project in which the researchers started off with a baseline analysis of the homes, including these HERS ratings, and the proceeding through various improvements. Before making any improvements, however, they simulated occupancy of the homes and measured the energy consumption.
The graph below (marked Fig. 4) shows the spread of cooling energy use for the four homes as calculated by the energy modeling of the six raters and the monitored energy use with simulated occupancy. As you can see, the raters’ numbers were significantly higher than the monitored results in nearly every case.
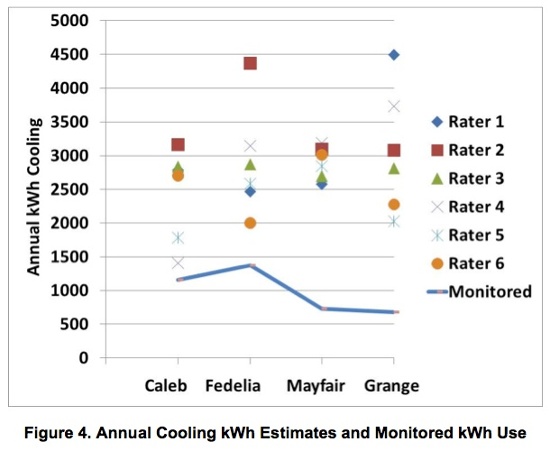
One interesting thing to notice here is that for the Mayfair, the raters had pretty good agreement. As shown in Table 1 (above), their results differed from one another by a maximum of 24%. The mean of their six results is 2903 kWh. The measured result for cooling energy use is 731 kWh. I could tell you how many standard deviations of the mean separate the results (22), but the graphic below shows what it means to be precise but not accurate. For that illustration to be numerically correct, though, the cluster of shots would have to be much farther from the bullseye.

California HERS ratings
HERS ratings in California are not in the purview of RESNET, the nonprofit organization that oversees HERS ratings in most of the country. The state oversees the work of HERS raters there. The California guidelines are similar to RESNET’s, with the same basic structure and quality assurance requirements. The California Energy Commission has a page on their HERS program, with links to their regulations, technical manual, and more.
Are HERS ratings worthless?
It’s certainly tempting to think that HERS ratings are a waste of money when you see how imprecise and inaccurate these ratings are. After all, if the six raters here can differ so much from one another and from the measured results, that doesn’t engender a lot of confidence in the process.
Even though California’s rating process is separate from RESNET’s, it’s structured similarly so two factors are probably most responsible for the discrepancies the researchers found in this study. One is that a HERS rating is an asset label. It’s not meant to align perfectly with actual energy use because it’s designed as a way to help you compare one house to another without the differences that arise from the way people live in their homes.
The other factor is quality assurance (QA). I wrote about this recently because RESNET is going through the process of trying to get greater consistency in HERS ratings (and unfortunately trying to go down the wrong road).
My company, Energy Vanguard, is a HERS provider, and I think we do a pretty good job with QA. We train our raters well and don’t just automatically approve every file sent our way. Sometimes a rater will have to make corrections to a file three or four times before we approve it, and probably about half of the files we get need at least one correction.
But I think we go further than many. RESNET requires providers to check only 10% of all files, meaning 90% can get approved without anyone looking at them. And, as I wrote in my article about RESNET’s improvement efforts, RESNET has done little to no technical oversight of providers, so it’s not hard for bad ratings to get all the way through the process. I’m sure it’s not much different in California, and that’s why Proctor, Chitwood, and Wilcox found the results described here.
I think home energy ratings are a useful tool. They’re not as good as they can be, however, and I think studies like this one can help expose the problems. Only then can we fix them.
External Source
HERS Estimates Vs. Energy Consumption – a report at the Proctor Engineering website containing some of the results described above
Related Articles
Everything You Ever Wanted to Know about the HERS Index
Stockton Project Demonstrates Huge Home Energy Savings
Why Is RESNET Limiting Its Options for Improvement?
Forget the People — A Home Energy Rating Is an Asset Label
All but one of the images and graphs here are from the reports of John Proctor, Rick Chitwood, and Bruce Wilcox. The red bullseye image is from Wikimedia Commons and is in the public domain.
NOTE: Comments are moderated. Your comment will not appear below until approved.
This Post Has 14 Comments
Comments are closed.
One correction Allison. In
One correction Allison. In the original report there were 7 raters, one did not use the California protocols and did not produce comparable information. So they were dropped from subsequent reports. So there are 6 Raters all using the same protocol.
Hmmm, My immediate question
Hmmm, My immediate question is why would anyone want to spend money on a HERS rating?
Next question; if you are looking to solve this, are you asking for accuracy where no clear definition exists?
Without a hard reconciliation point how do you have the ability to say which rating is right and which is wrong, or even which is closer than the other?
The most recent version of
The most recent version of the report is:
http://www.proctoreng.com/media/HERS.html
John Proctor
John Proctor: Thanks for the correction. I’ve revised the article. I’ve also added the link to the article on your website.
ted k.: Ah, but there are definitions. The HERS modeling is based on a set of conditions, so it’s certainly possible to reconcile modeled with monitored results. And even though the HERS rating is an asset label, you can adjust the parameters to match the operational characteristics to see how close the modeled and monitored results are as well. The main problem, as I described above, seems to be sloppy work on the part of at least some of the raters and lack of oversight from their QA providers.
Nate A.:
Nate A.: Good question. I haven’t seen all the data from their study, but what I have seen indicates some serious problems with data collection and entry. Ceiling insulation R-values that vary from 19 to 49 in one house is a rater problem, not system design. Also, I don’t have direct experience with ratings in California, but I’ve talked with enough people to know they have some of the same problems we have in the rest of the country with poor QA of raters by providers and insufficient oversight of providers.
It appears to be a vicious
It appears to be a vicious cycle of trying to get people of competence and integrity. I think we only needed the Raters to monitor what the building contractors were NOT doing properly and now we need monitors for the monitors. Pay for a competent conscientious contractor and get what you pay for.
The surveys in this study are
The surveys in this study are ALL predicting electrical usage for cooling above actual. There could be several causes for this but it’s interesting that the predictions ALWAYS have a positive variance. Not a single data point below actual usage. In troubleshooting parlance that’s called “PECULIAR”.
There are other issues but that’s the one that jumps out at me.
Allison, Kudos for publishing troublesome work in progress.
This problem is directly
This problem is directly related to the Flow of Information from RESNET to QA designees and a separate flow from RESNET to Raters and a 3rd stream from a QAD to the raters involved.
If RESNET were to communicate the same information to all QADs and RATERs on documentation requirements.
My QAD requires a ruler in the insulation picture to be in my file. If every one of those 6 raters were required to have the same information in their file for documentation, any discrepancy in the attic insulation could be dealt with.
If the transparency in communication was present, some mistakes could be eliminated. The other piece would be for RESNET to select files for the QAD to do a desk audit. Provide all required documentation. If the RATER didn’t collect what both the RATER and the QAD had been told to collect … RESNET can take action.
Takes 30 days to implement.
I was frankly very
I was frankly very disappointed with the HERS rating I got for the Hiram College TREE House. It was effectively useless. What does it mean? The data contained in it was very difficult to decipher.
… And now I’m finding that there is huge variance in this rating that I already couldn’t find meaning in? Hmm. I only selected a HERS rating so they would have something to brag about for the project, what does it actually mean, though? And how can I explain to them that the number will change when a new energy code comes out?
Wouldn’t usage/sf or annual $ usage be more useful, a the end of the day?
Also, you said “I’ve talked with enough people to know they have some of the same problems we have in the rest of the country with poor QA of raters by providers and insufficient oversight of providers.”
Isn’t that a systemic problem? Could the design of the system be flawed? What reason to raters have to be accurate if their work is never tied to anything?
Sorry, I’ve been cooling to the idea of HERS ratings since the TREE House, and this is not helping. I just don’t see the value if there is no accountability for raters.
Thanks for that Allison. I
Thanks for that Allison. I am curious if only the Blower Door and Duct Leakage test results for each rater could be posted, to see what variance exists in the measurements? And also, were the models “trued” to actual energy consumption history using the Audit tab (or whatever the California software equivalent is)? In other words, was the intent of the survey to assess ratings, or to assess audits?
Thanks for posting.
I got to say I have to wonder
I got to say I have to wonder about the “who” was hired and their experience. As for simulating use – that’s fine as long as it meets how it is figured for RESNET or they should calculate out the difference to true their model if they wish to do that
Several of the questions
Several of the questions above should be answered.
1) Most if not all of the Raters were experienced. I know some of them myself.
2) The houses were operated with the same set point schedule and occupancy internal gains as are integrated into the HERS software.
3) So the only “true up” as adjusting to the Standard outdoor conditions that are used in the HERS weather file. This too was done.
4) Correct, this shows two problems — data collection and input AND fundamental errors in the software.
New homes don’t have energy
New homes don’t have energy histories, so solving variance issues will be difficult (though Danny Parker believes this is solvable; http://bit.ly/dannyparkeraccuracyvideo)
Houses with existing histories there is an obvious reconciliation point. That RESNET doesn’t connect theory to reality here is disappointing.
Others have raised the issue of HERS being a silk suit:
http://bit.ly/energywise-hersratingsdontcorrelatetoenergyuse
http://bit.ly/HERS-2PerformanceFAIL
Will Allison be the lightning rod that drives change and accountability into this broken system? We can hope and admire his effort, but I’m wouldn’t bet the farm.
The problem is absolutely
The problem is absolutely with the raters and the QAD, but I think the problem is solved at the Provider level.
We have the same problem here in Michigan. We have a rating company that does business in our area from Indiana. Some of their builder clients have switched over to our company due issues they have had with them. We have reviewed the ratings they have done and they are basically rubber stamping all their ratings. The builders have told us that their raters spend about 10 minutes at the house at final inspection and in most cases don’t even do a pre-drywall inspection. This is extremely frustrating to know there is a rating company from out of state rubber stamping projects and taking away business from our company.
If this type of thing continues to happen the HERS rating will lose credibility. Bottom line is we need better QAD and providers.
Its good to know that there are providers out there like EnergyVanguard that look at more than just the 10%. We work with Building Efficiency Resources (The BER) and they are a great Provider as well. They look at all the ratings that come through. I truly believe that if we want to solve this problem it gets solved at the Provider level. RESNET needs to get the shady Providers out of the system. Not only does this improve QA naturally, but it gives an opportunity for the good Providers to get more business.
As a rater, I understand that there is going to be variation among raters. The process isn’t perfect. The raters that are rubber stamping projects are what we need to go after as an industry. They will ultimately bring us down.