Moisture Transport, Sorption Isotherms, and Aliens Drinking Beer

You know about the fourth state of water. (You read my last article, Introduction to the Physics of Water in Porous Materials, right?) Not liquid, not vapor, and not solid, it has properties similar to liquid water but not quite the same. Today we’ll take a look at how that physics affects the transport of water through porous materials.
You know about the fourth state of water. (You read my last article, Introduction to the Physics of Water in Porous Materials, right?) Not liquid, not vapor, and not solid, it has properties similar to liquid water but not quite the same. Today we’ll take a look at how that physics affects the transport of water through porous materials.
The 3 transport modes
When humid air interacts with porous, hygroscopic materials, it does what Homer Simpson says to do: “In this house, we obey the Laws of Thermodynamics.” Water gets into the material and moves to where it’s drier. It does so in one of these three ways:
- Vapor diffusion
- Surface diffusion
- Capillary flow
Vapor diffusion carries water vapor through the material in the vapor state. It doesn’t stick to any of the surfaces it encounters. It just floats on through in the empty space of the pores. Not much water gets through like that.
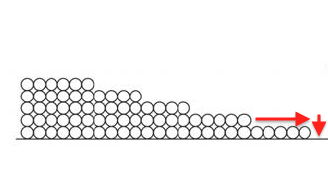
Surface diffusion moves more water than vapor diffusion. This happens because of that attraction I discussed earlier. Since the first monolayer is attracted the most strongly, it’s energetically favorable for a molecule in the second monolayer to move down to the first layer if it can, as shown below.

Likewise, molecules from the third monolayer want to move down to the second, the fourth to the third, and so on. In that fashion, water can move through a porous material via surface diffusion.
But things really open up when the capillaries start filling up. Once a pore is completely full, water can move more rapidly through the porous material. That’s capillary flow.
Sorption isotherms
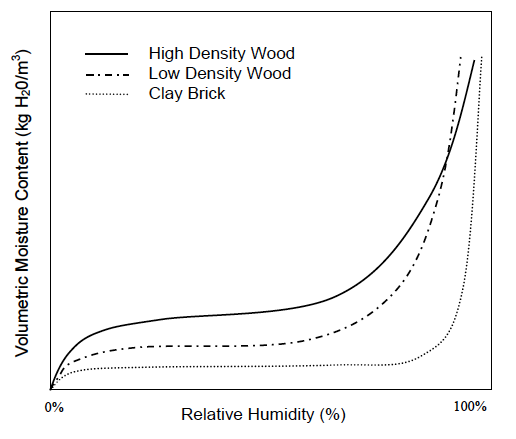
Now we can put all this together and understand what’s going on in these geeky things called sorption isotherms. The graph below, taken from Professor Timusk’s doctoral thesis, is a good example.

First, let me point out that there are three curves here: two for different densities of wood and one for clay brick. Each one shows the moisture content in the material as a function of the relative humidity of the surrounding air.
Notice that each curve exhibits the same pattern: a rapid rise, a flattening out, and then another rapid rise. Recalling the explanations above for adsorption and the three types of moisture transport, what do you think is happening in those regions? See if you can figure it out before going on to the next paragraph. To distract your cheating eyes from “accidentally” reading the answer first, I’ll let you look at this picture of aliens drinking beer. Now think!

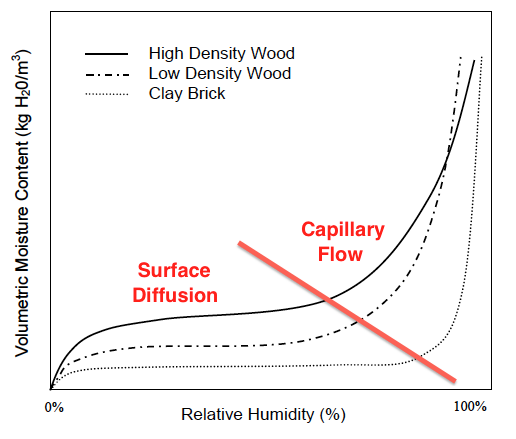
Well, first off, the curves show surface diffusion and capillary flow. We know capillary flow starts at higher relative humidities, so the initial rise and the flattened out part are where surface diffusion is happening. But why does the initial rise flatten out so quickly?
Recall that the first monolayer feels the strongest attraction for the surface. It gets filled at about 10% relative humidity. The flat part of the curve is mostly filling the second monolayer plus a bit more in wood and significantly more in brick.
When the curves shoot up again, capillary flow has kicked in (see graph below). Now the moisture content can increase rapidly with increasing relative humidity. And here’s where we can see something really interesting about the difference between materials.

Notice that capillary flow doesn’t start in the brick until the relative humidity is much higher than in the two types of wood. Hmmm. What could cause the capillaries not to fill up at lower relative humidity like it does in wood? Why of course. It’s because they’re bigger!
Another important thing to know about sorption isotherms is that the curves you see above are for a specific temperature. As you raise or lower the temperature, the curves shift. Why? Because the amount of moisture a material can hold at a give relative humidity depends on how warm or cool it is.
Warmer materials cannot hold as much moisture because there’s enough heat there to dry them out. Cooler materials hold more moisture. In fact, Bill Rose calls this the Fundamental Rule of Material Wetness: Warm materials tend to be dryer and cool materials tend to be wetter.
And now you can look at sorption isotherms and understand what they’re telling you about materials. At least I hope that’s your main takeaway here, although “What?! Aliens drink beer?” is probably a strong one, too.
Read Part 1: Introduction to the Physics of Water in Porous Materials
Related Articles
The Experts Discuss Hygrothermal Analysis
Is This the End of the Double-Wall, Cold Sheathing Scare?
Moisture and the Quirkiness of OSB
The Wicked Witch of the West, Phase Changes, and Building Science
Sources
The main source I used for this article and the previous one on the physics of water in porous materials was chapter 3 of Professor Chris Timusk’s doctoral thesis (pdf). Most of the rest came from Dr. Joseph Lstiburek’s presentations on building science fundamentals and hygrothermal analysis, Wikipedia, and Bill Rose’s book, Water in Buildings.
Image Credits
#1 from Eric George of Building Performance Group. #2 is a modification of an image from Building Science Corporation. #3 & #5 from doctoral thesis of Professor Chris Timusk (pdf), with modification on #5. #4 by http://www.flickr.com/photos/gray_um/ from flickr.com, used under a Creative Commons license.
NOTE: Comments are moderated. Your comment will not appear below until approved.
This Post Has 9 Comments
Comments are closed.

Allison, <br /
Allison, <br /> <br />I’m trying to keep up with you. <br /> <br />I’m envisioning the test rig for the graphical data shown as one where each sample (wood, wood, brick) is placed in a chamber in which the temperature is held constant. A provision is made for constant reading of the sample weight. The relative humidity (RH)of the chamber is then increased in increments, on each occasion reaching equilibrium. The weight is taken and the weight per volume is plotted vs. the RH. There is no notion of TIME in the data. <br /> <br />OK. Now I read under the graph: "Notice that capillary flow doesn’t START in the brick until much LATER than it does in the two types of wood. What could cause the capillaries not to fill up as QUICKLY?" I’m wondering if we might instead say something like: "Notice that capillary flow doesn’t occur in the brick until the RH has risen above about 80%RH whereas in the wood, capillary flow begins in the range of about 60-70%RH. What could cause the capillaries not to fill until the RH is quite high? Why of course …." <br /> <br />Also, I’m wondering if we can be satisfied regarding temperature that the data is isothermal? For example, would we get the same curves at T = 10F? 32F? 90F? <br /> <br />Note: I’m not disputing your fine article and you may wish to make no changes. I’m just saying out loud stuff that buzzes through my head. (Note also I have not accessed the ‘links’ you so thoughtfully provided.) <br /> <br />Regards,
Allison,
Allison,
I’m trying to keep up with you.
I’m envisioning the test rig for the graphical data shown as one where each sample (wood, wood, brick) is placed in a chamber in which the temperature is held constant. A provision is made for constant reading of the sample weight. The relative humidity (RH)of the chamber is then increased in increments, on each occasion reaching equilibrium. The weight is taken and the weight per volume is plotted vs. the RH. There is no notion of TIME in the data.
OK. Now I read under the graph: “Notice that capillary flow doesn’t START in the brick until much LATER than it does in the two types of wood. What could cause the capillaries not to fill up as QUICKLY?” I’m wondering if we might instead say something like: “Notice that capillary flow doesn’t occur in the brick until the RH has risen above about 80%RH whereas in the wood, capillary flow begins in the range of about 60-70%RH. What could cause the capillaries not to fill until the RH is quite high? Why of course ….”
Also, I’m wondering if we can be satisfied regarding temperature that the data is isothermal? For example, would we get the same curves at T = 10F? 32F? 90F?
Note: I’m not disputing your fine article and you may wish to make no changes. I’m just saying out loud stuff that buzzes through my head. (Note also I have not accessed the ‘links’ you so thoughtfully provided.)
Regards,
Allison, we have something in
Allison, we have something in common in addition to liking the fine food served at my favorite Dallas restaurant: a passion for distilling complex information into very practical, useful terms. You excel at this, and I’m confident my gratitude for it is shared by many who read your work. <br /> <br />I enjoyed both of your articles on this subject, and I believe such will help me understand desiccant wheel behavior better, since I deal with that a lot in my line of work. Not to mention the ever relevant matter of how liquid water and water vapor transports through building assemblies. Where I work now, we have a lot of buildings! <br /> <br />Looking forward to seeing you at #bscamp. Everything’s booked and I’m ready for August!
Allison, we have something in
Allison, we have something in common in addition to liking the fine food served at my favorite Dallas restaurant: a passion for distilling complex information into very practical, useful terms. You excel at this, and I’m confident my gratitude for it is shared by many who read your work.
I enjoyed both of your articles on this subject, and I believe such will help me understand desiccant wheel behavior better, since I deal with that a lot in my line of work. Not to mention the ever relevant matter of how liquid water and water vapor transports through building assemblies. Where I work now, we have a lot of buildings!
Looking forward to seeing you at #bscamp. Everything’s booked and I’m ready for August!
I’m surprised that High
I’m surprised that High Density Wood absorbs water more quickly than Low Density Wood. What am I not understanding?
I’m surprised that High
I’m surprised that High Density Wood absorbs water more quickly than Low Density Wood. What am I not understanding?
I’m trying to understand this
I’m trying to understand this. The capillaries get a coating of molecules first, that’s the early part of the curve. Then they get a thicker coating, that’s the middle part of the curve. Then when they get just enough water molecules to meet in the middle a whole lot of water vapor gets sucked in by capillarity and that’s the right hand side of the curve. Do I have that right? <br /> <br />Let’s say we were able to very carefully break apart the wood and the brick such that each capillary tube was perfectly split in half. Then we re-take the sorption measurements vs. RH. Should I expect the sorption curves to look different since there are no longer any capillaries? The literature seems to suggest that EMC is independent of capillary radius, so, I wonder. Maybe a slushy layer of water is more attractive to water vapor than air when RH rises? Maybe a long cave made with slushy, sort of liquid sort of vapor walls is more attractive to water vapor than air when RH rises? <br /> <br />Or, better yet, what if I were that one water molecule that luckily found the smallest radius capillary in the entire test sample and I was also lucky enough to find the exact spot in that capillary where my presence exactly filled the middle of the tube from side to side. Which way do I now move? And does that movement preferentially attract more vapor behind me? <br /> <br />I need one of those huge alien eyeball to look inside those tiny capillaries to see what’s really going on. <br /> <br />To be continued with beverages in hand.
I’m trying to understand this
I’m trying to understand this. The capillaries get a coating of molecules first, that’s the early part of the curve. Then they get a thicker coating, that’s the middle part of the curve. Then when they get just enough water molecules to meet in the middle a whole lot of water vapor gets sucked in by capillarity and that’s the right hand side of the curve. Do I have that right?
Let’s say we were able to very carefully break apart the wood and the brick such that each capillary tube was perfectly split in half. Then we re-take the sorption measurements vs. RH. Should I expect the sorption curves to look different since there are no longer any capillaries? The literature seems to suggest that EMC is independent of capillary radius, so, I wonder. Maybe a slushy layer of water is more attractive to water vapor than air when RH rises? Maybe a long cave made with slushy, sort of liquid sort of vapor walls is more attractive to water vapor than air when RH rises?
Or, better yet, what if I were that one water molecule that luckily found the smallest radius capillary in the entire test sample and I was also lucky enough to find the exact spot in that capillary where my presence exactly filled the middle of the tube from side to side. Which way do I now move? And does that movement preferentially attract more vapor behind me?
I need one of those huge alien eyeball to look inside those tiny capillaries to see what’s really going on.
To be continued with beverages in hand.
What does a beer sorption
What does a beer sorption isotherm look like in high density wood and where can I find some aliens to help me get all that beer out of my wall?