A Year of Home Electricity Monitoring Data
A little over a year ago, I wrote about the Emporia Vue home electricity monitoring system I installed at my house. I’ve posted data on LinkedIn and in some other articles since then. Now, though, I’ve got a whole year’s worth of data, so let me overwhelm you with graphs today. I’ll discuss each one briefly and give some of takeaways from the data. You may see more in there, too, so please comment and let me know what you see or about your own monitoring experience.
A note about the time period covered: All but one of the graphs below go from 1 July 2022 to 30 June 2023. The only one that’s different is the Vue vs. Georgia Power comparison. That one goes from 2 July to 30 June because that aligns the Vue data with the utility billing periods. It’s not exactly by calendar month either. Also, our home has been all-electric since 2019, so this is all of our energy use.
Whole-house electricity use
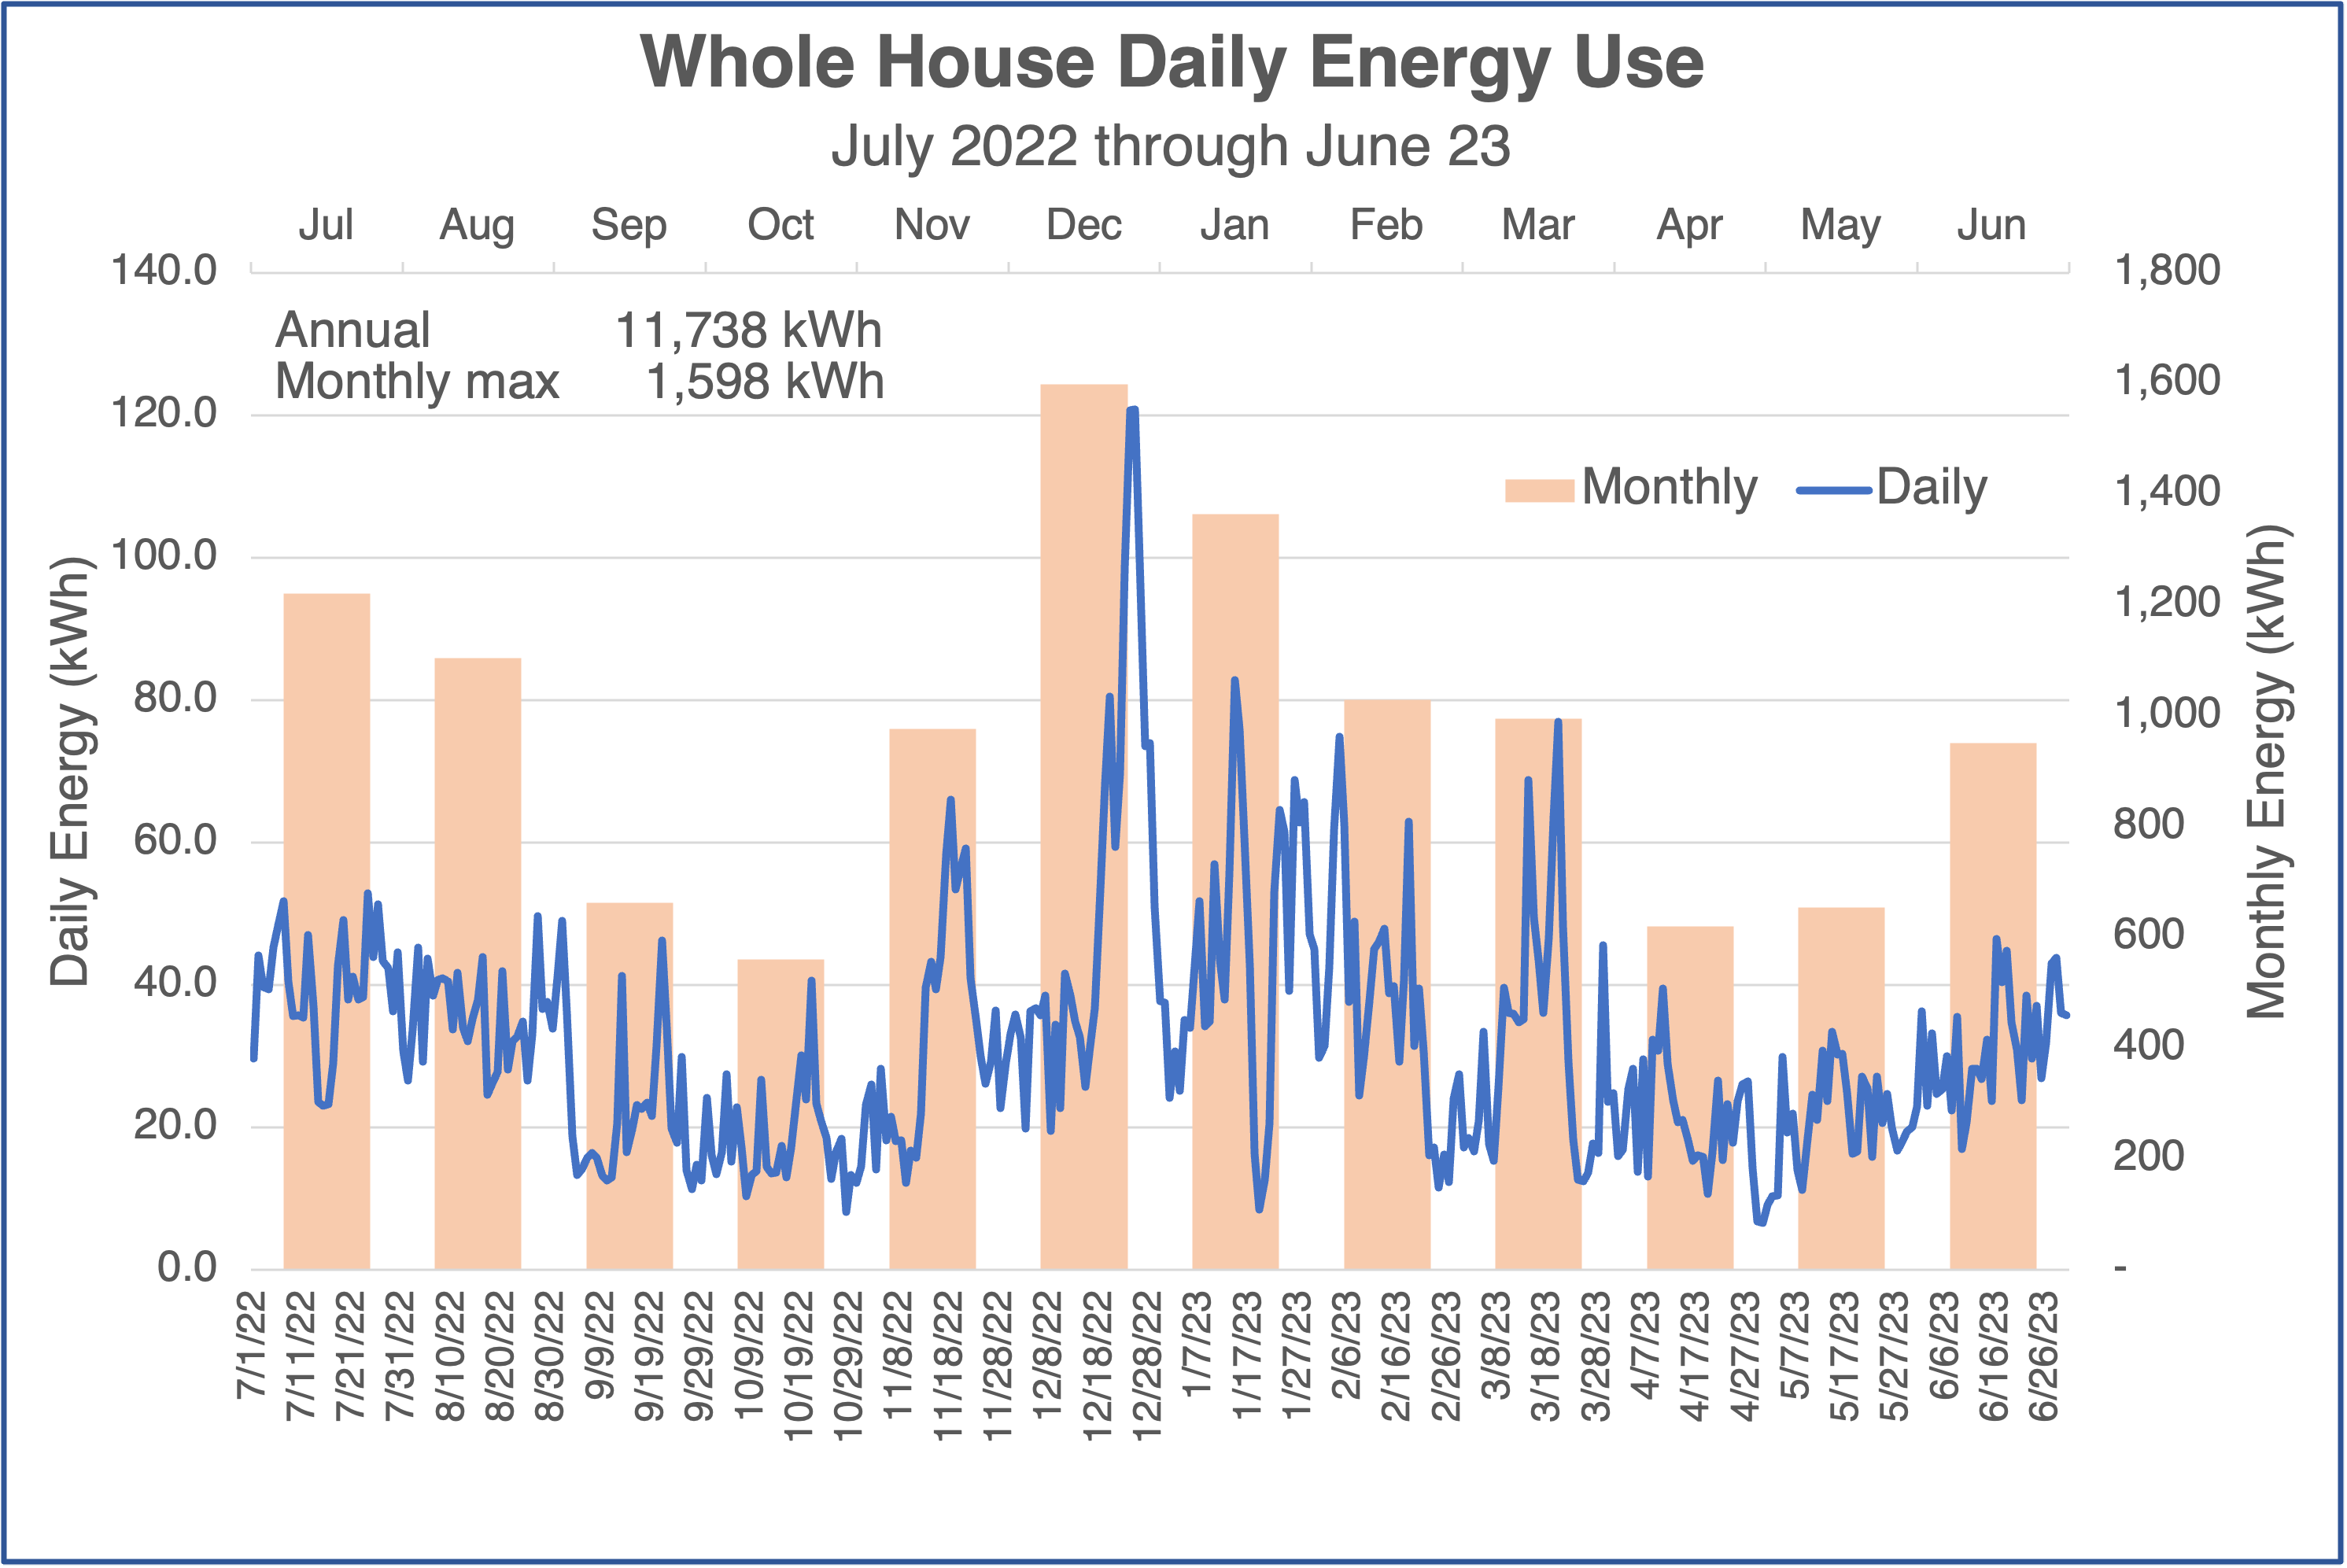
First, let’s look at the daily and monthly data for the whole house. The graph below shows both, daily in blue and monthly in columns. One thing that’s clear from the graph is that we use more energy in winter than in summer. (Is that because we use more energy for heating than for cooling? Hmmm.)
Also, the biggest daily spike and monthly consumption coincides with the arctic blast we had in December. The total for the year was 11,738 kilwatt-hours (kWh), so about 1,000 kWh per month. The biggest month was 1,598 kWh and the smallest 560 kWh.
If you’re like me, you’re probably wondering how this home electricity monitoring system compares to data from the electric utility. We’re with Georgia Power, and I track those data in a spreadsheet so the comparison is easy to do. You can see it in the graph below.
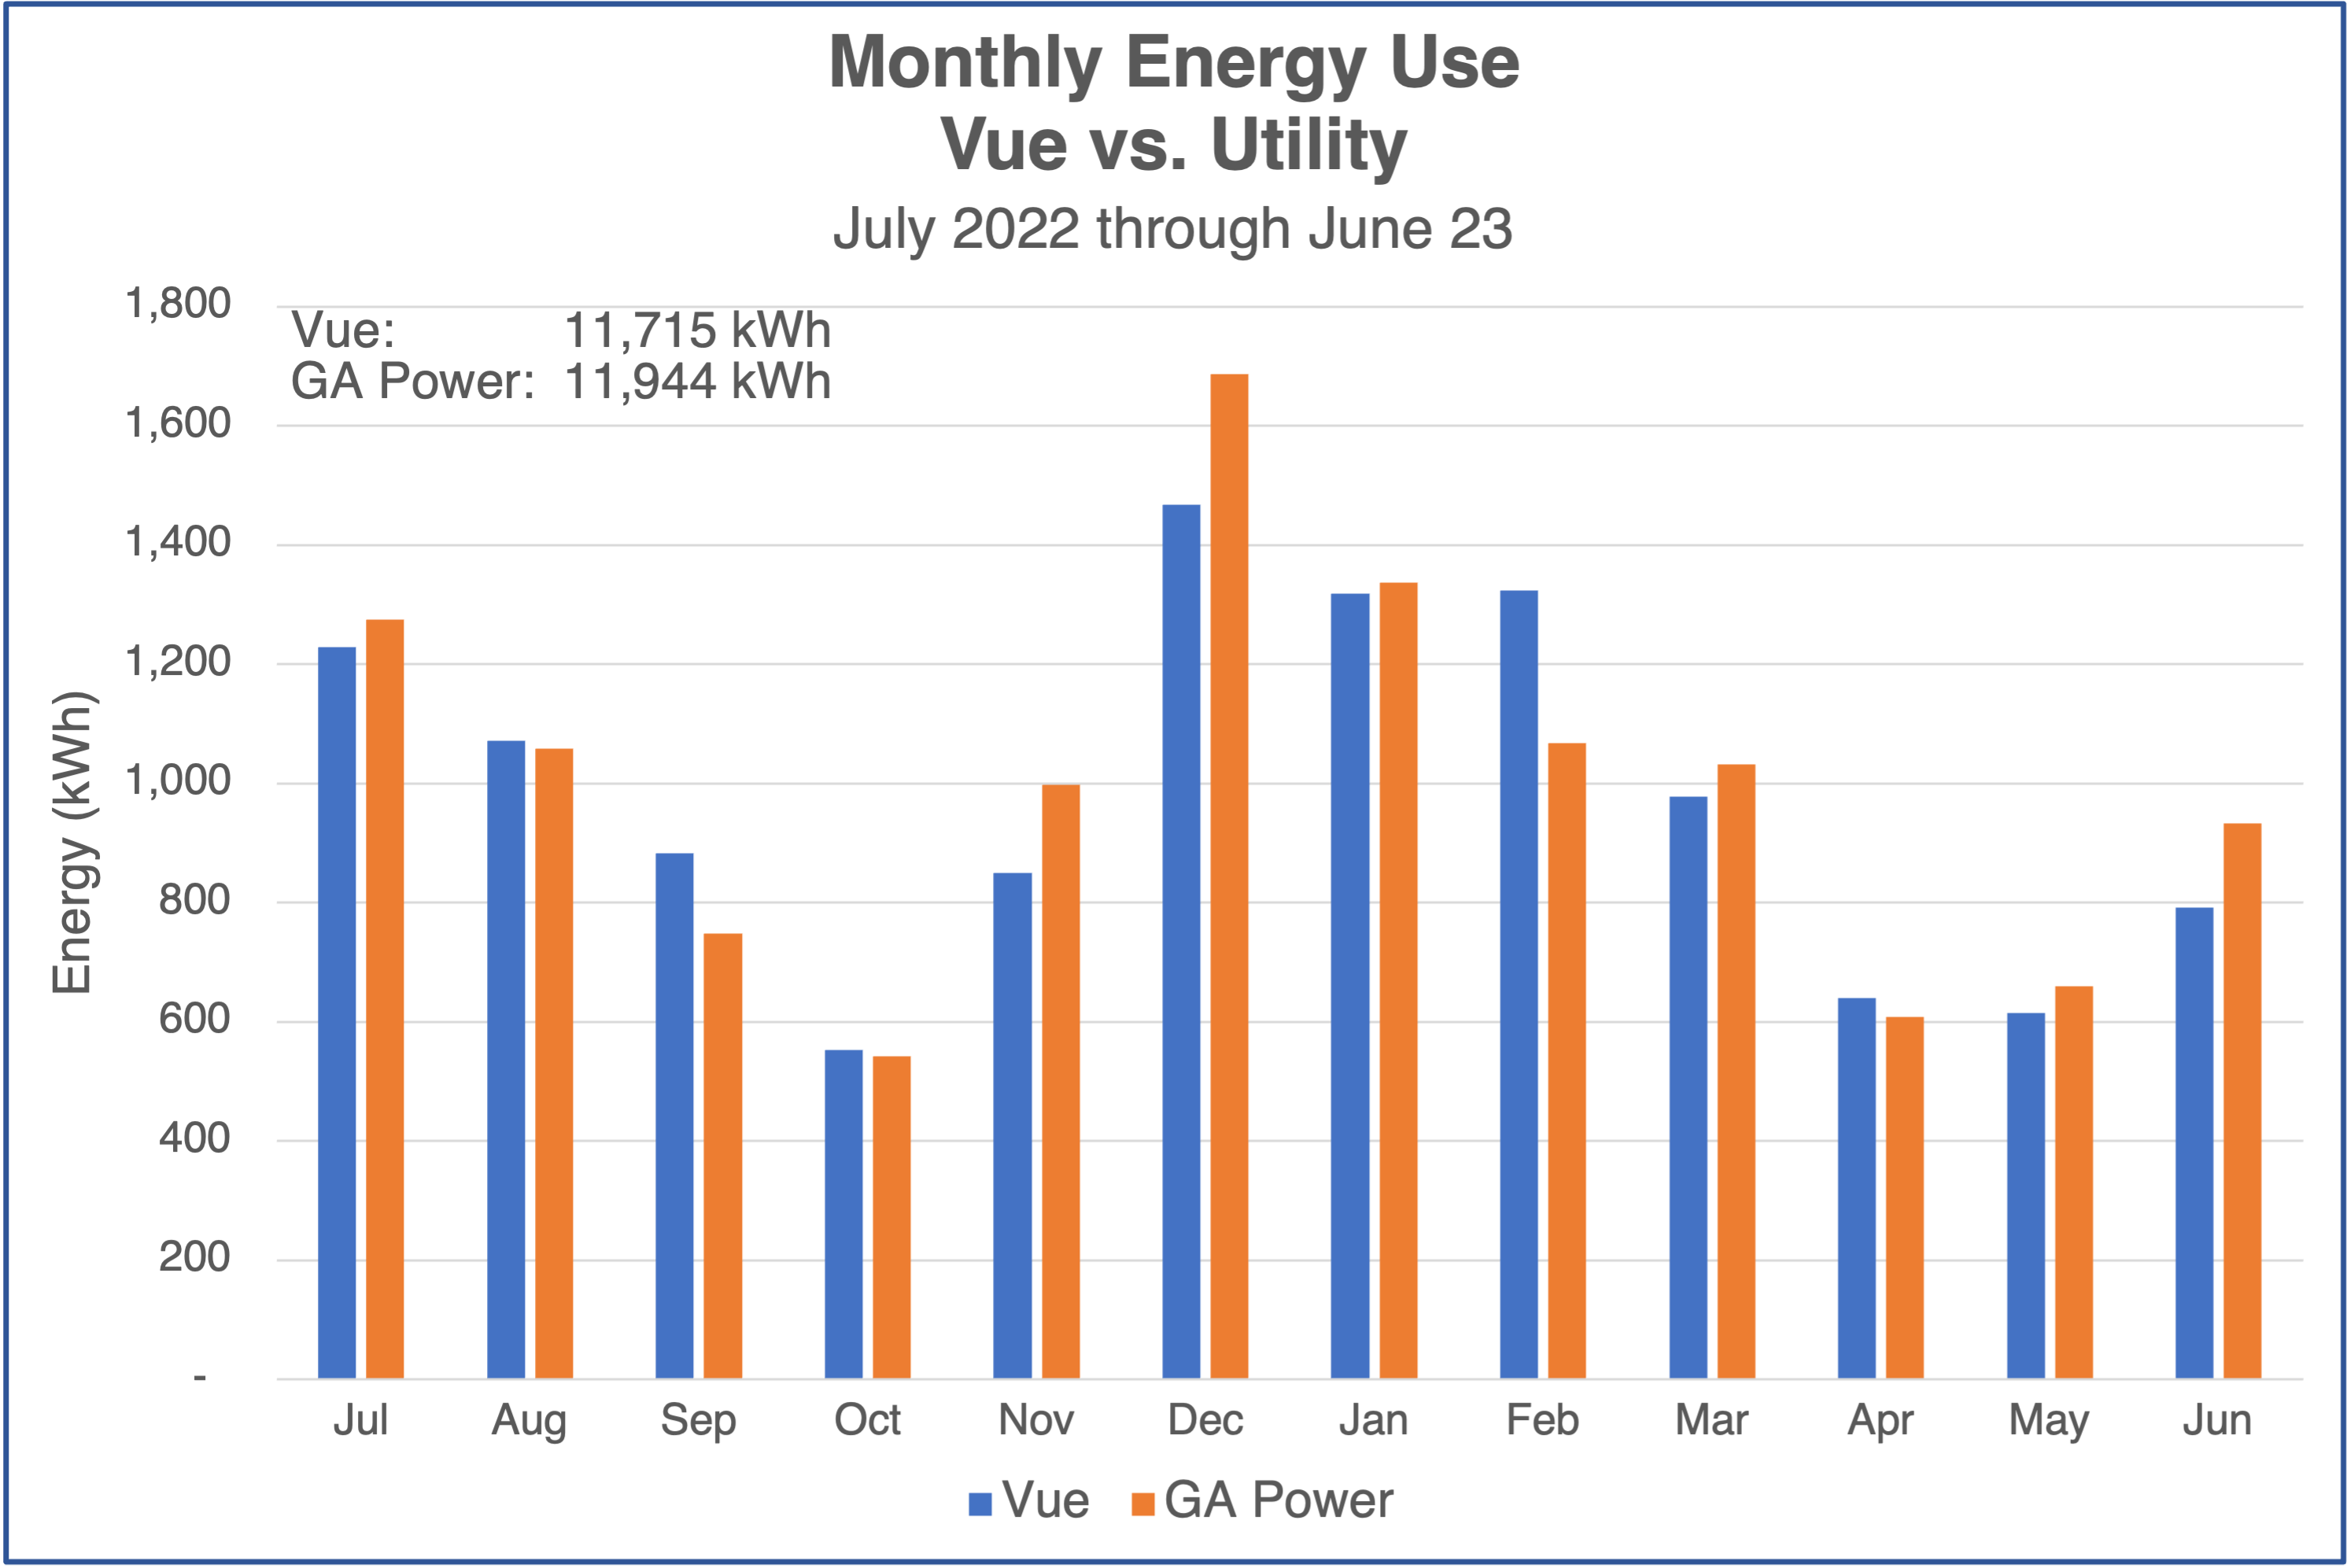
It’s interesting that the annual numbers are really close. The difference is only 2 percent. But the monthly variation can be quite large. Five of the twelve months had differences in the double-digit percentages, with the highest being 19 percent. It also doesn’t favor one over the other. Sometimes Vue is higher; sometimes Georgia Power is higher.
Annual use by select loads
Let’s break down where all the electrical energy is going. The graph below shows some of the individual loads. (HP stands for heat pump.) The biggest is my main heat pump (called “Attic HP” below). It accounts for 41 percent of our electricity use.
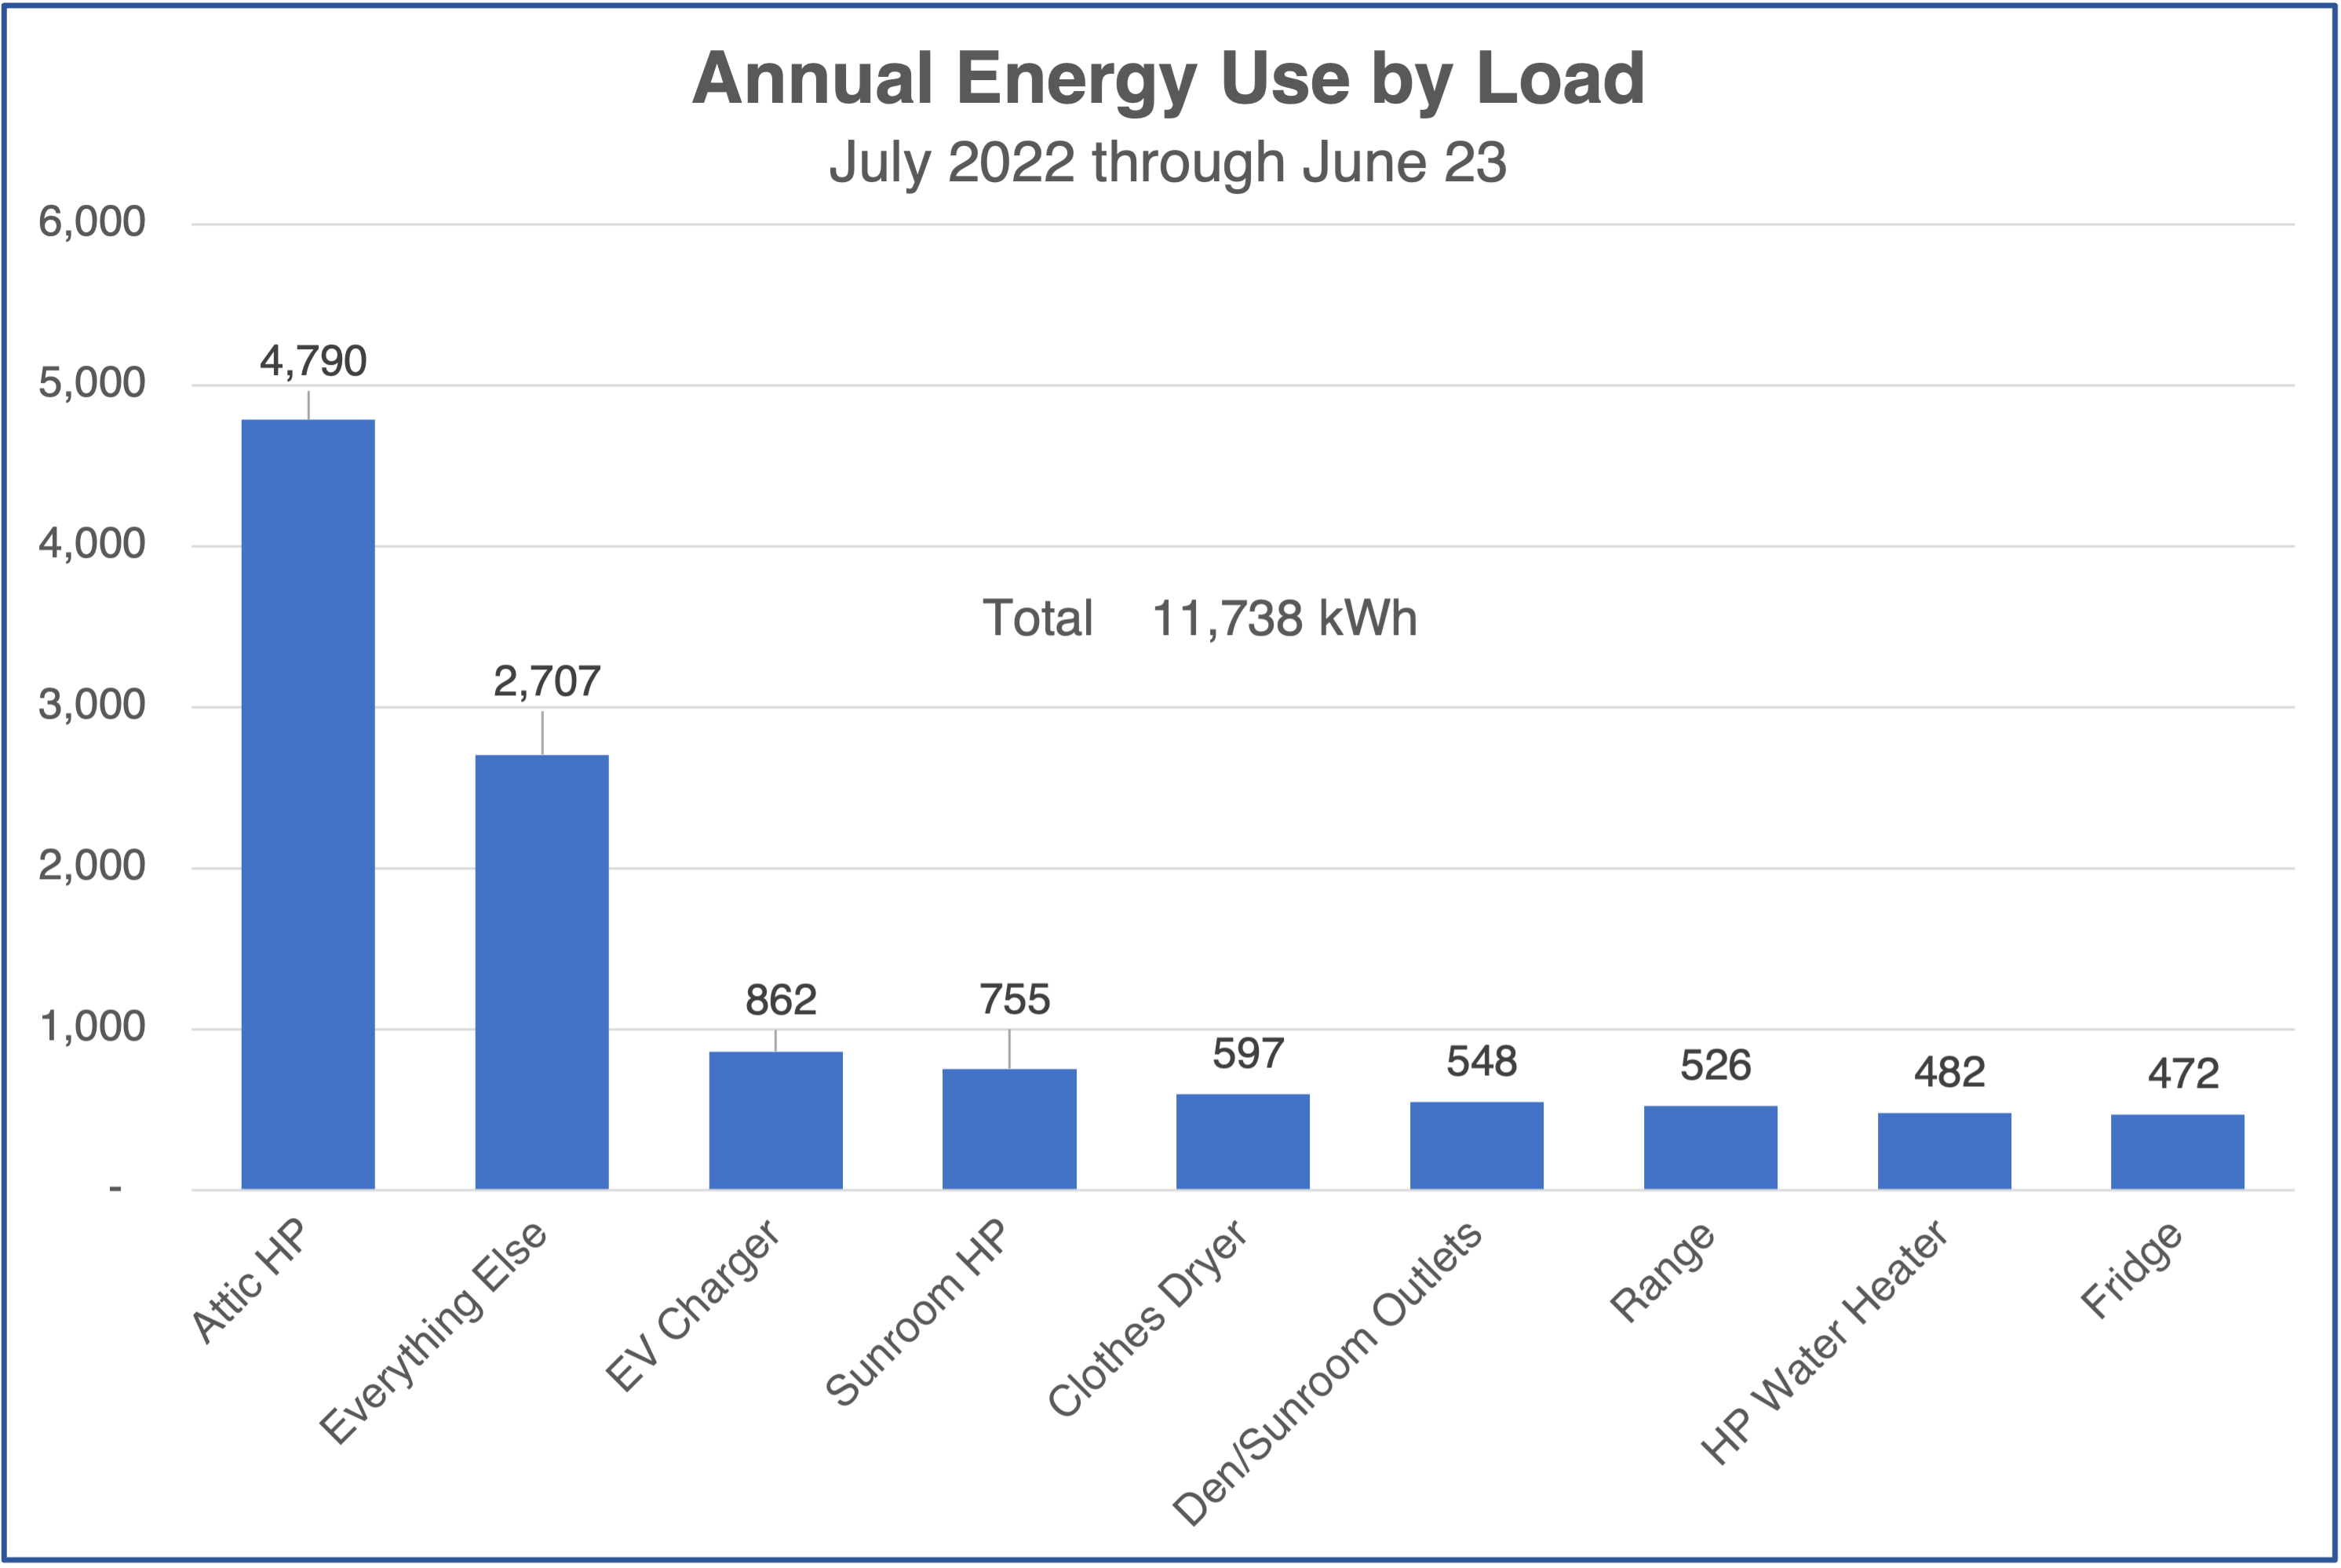
All the other individual loads are less than 1,000 kWh for the year. When I subtracted all the individual loads from the annual total, I found the energy used by everything not named. The “everything else” accounted for 2,707 kWh, or 23 percent of the total.
Heating and cooling
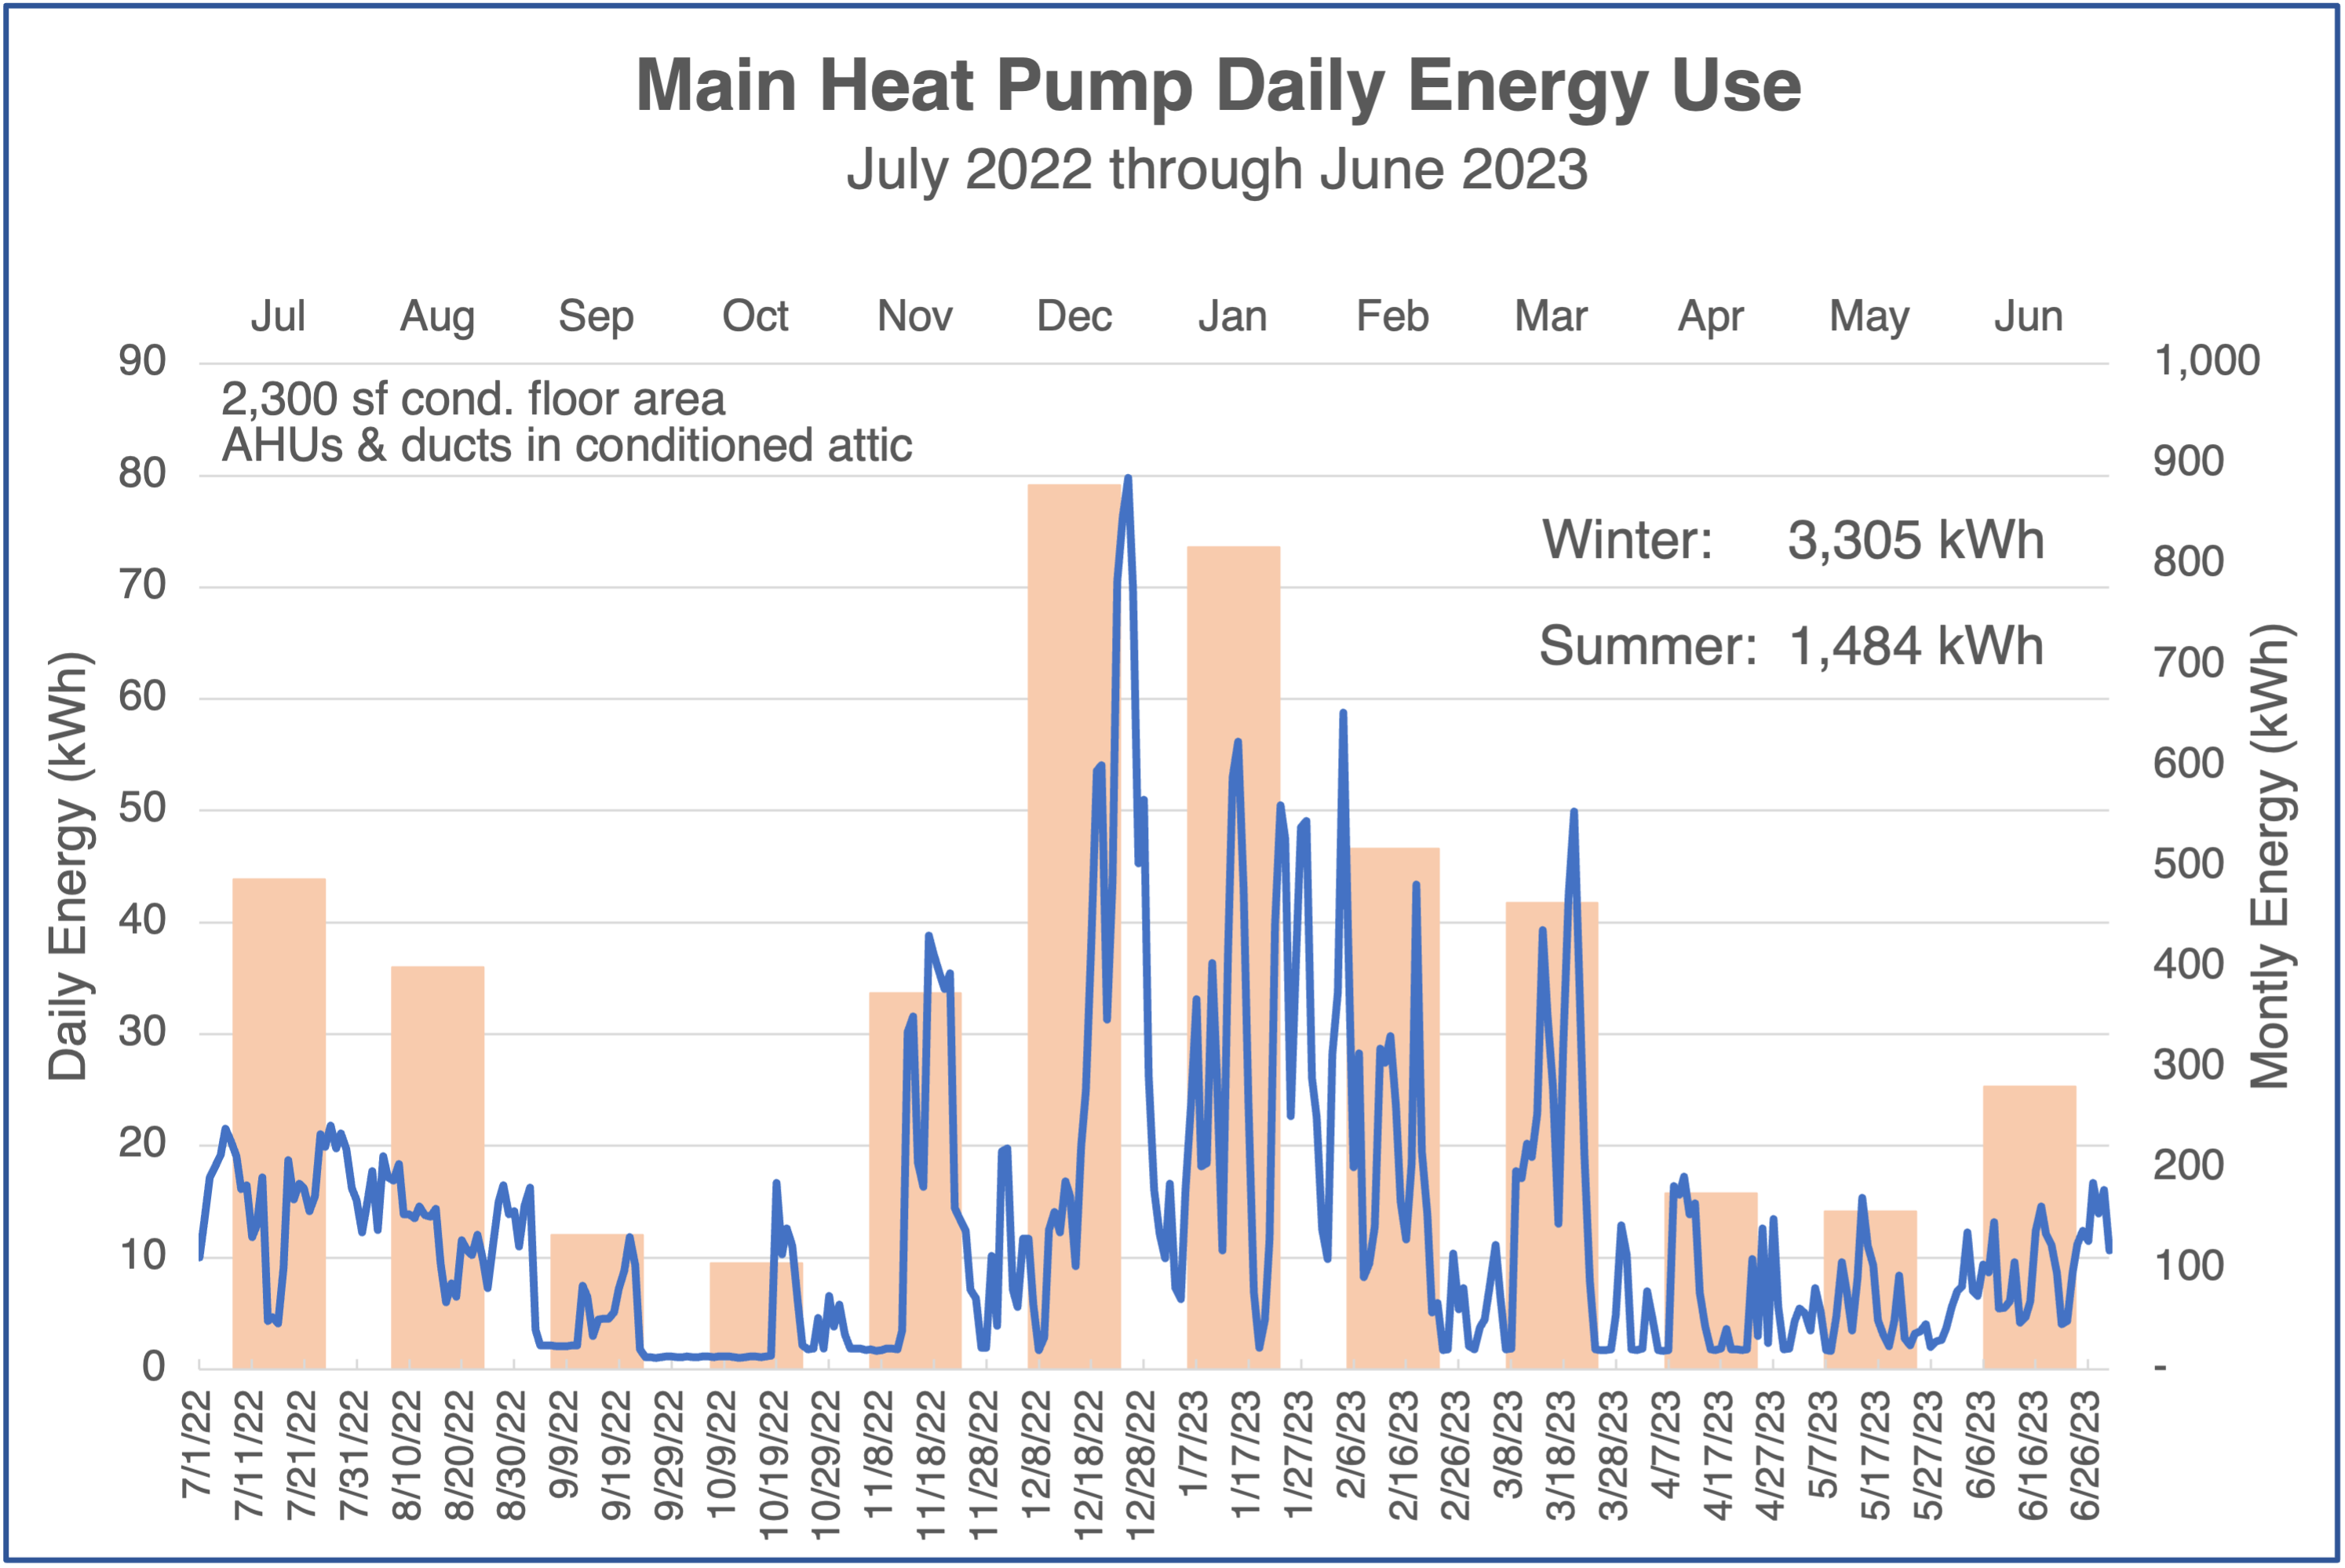
The biggest part of our heating and cooling energy goes to feed the inverter-driven heat pump with two low-static air handlers in our conditioned attic. You can see the daily and monthly data for it below. The big takeaway here is that we used 123 percent more energy for heating than for cooling. You can see the numbers on the graph. I’ve been shocking people for decades when I tell them we do more heating than cooling here in Atlanta. Here are the data proving it for one house.
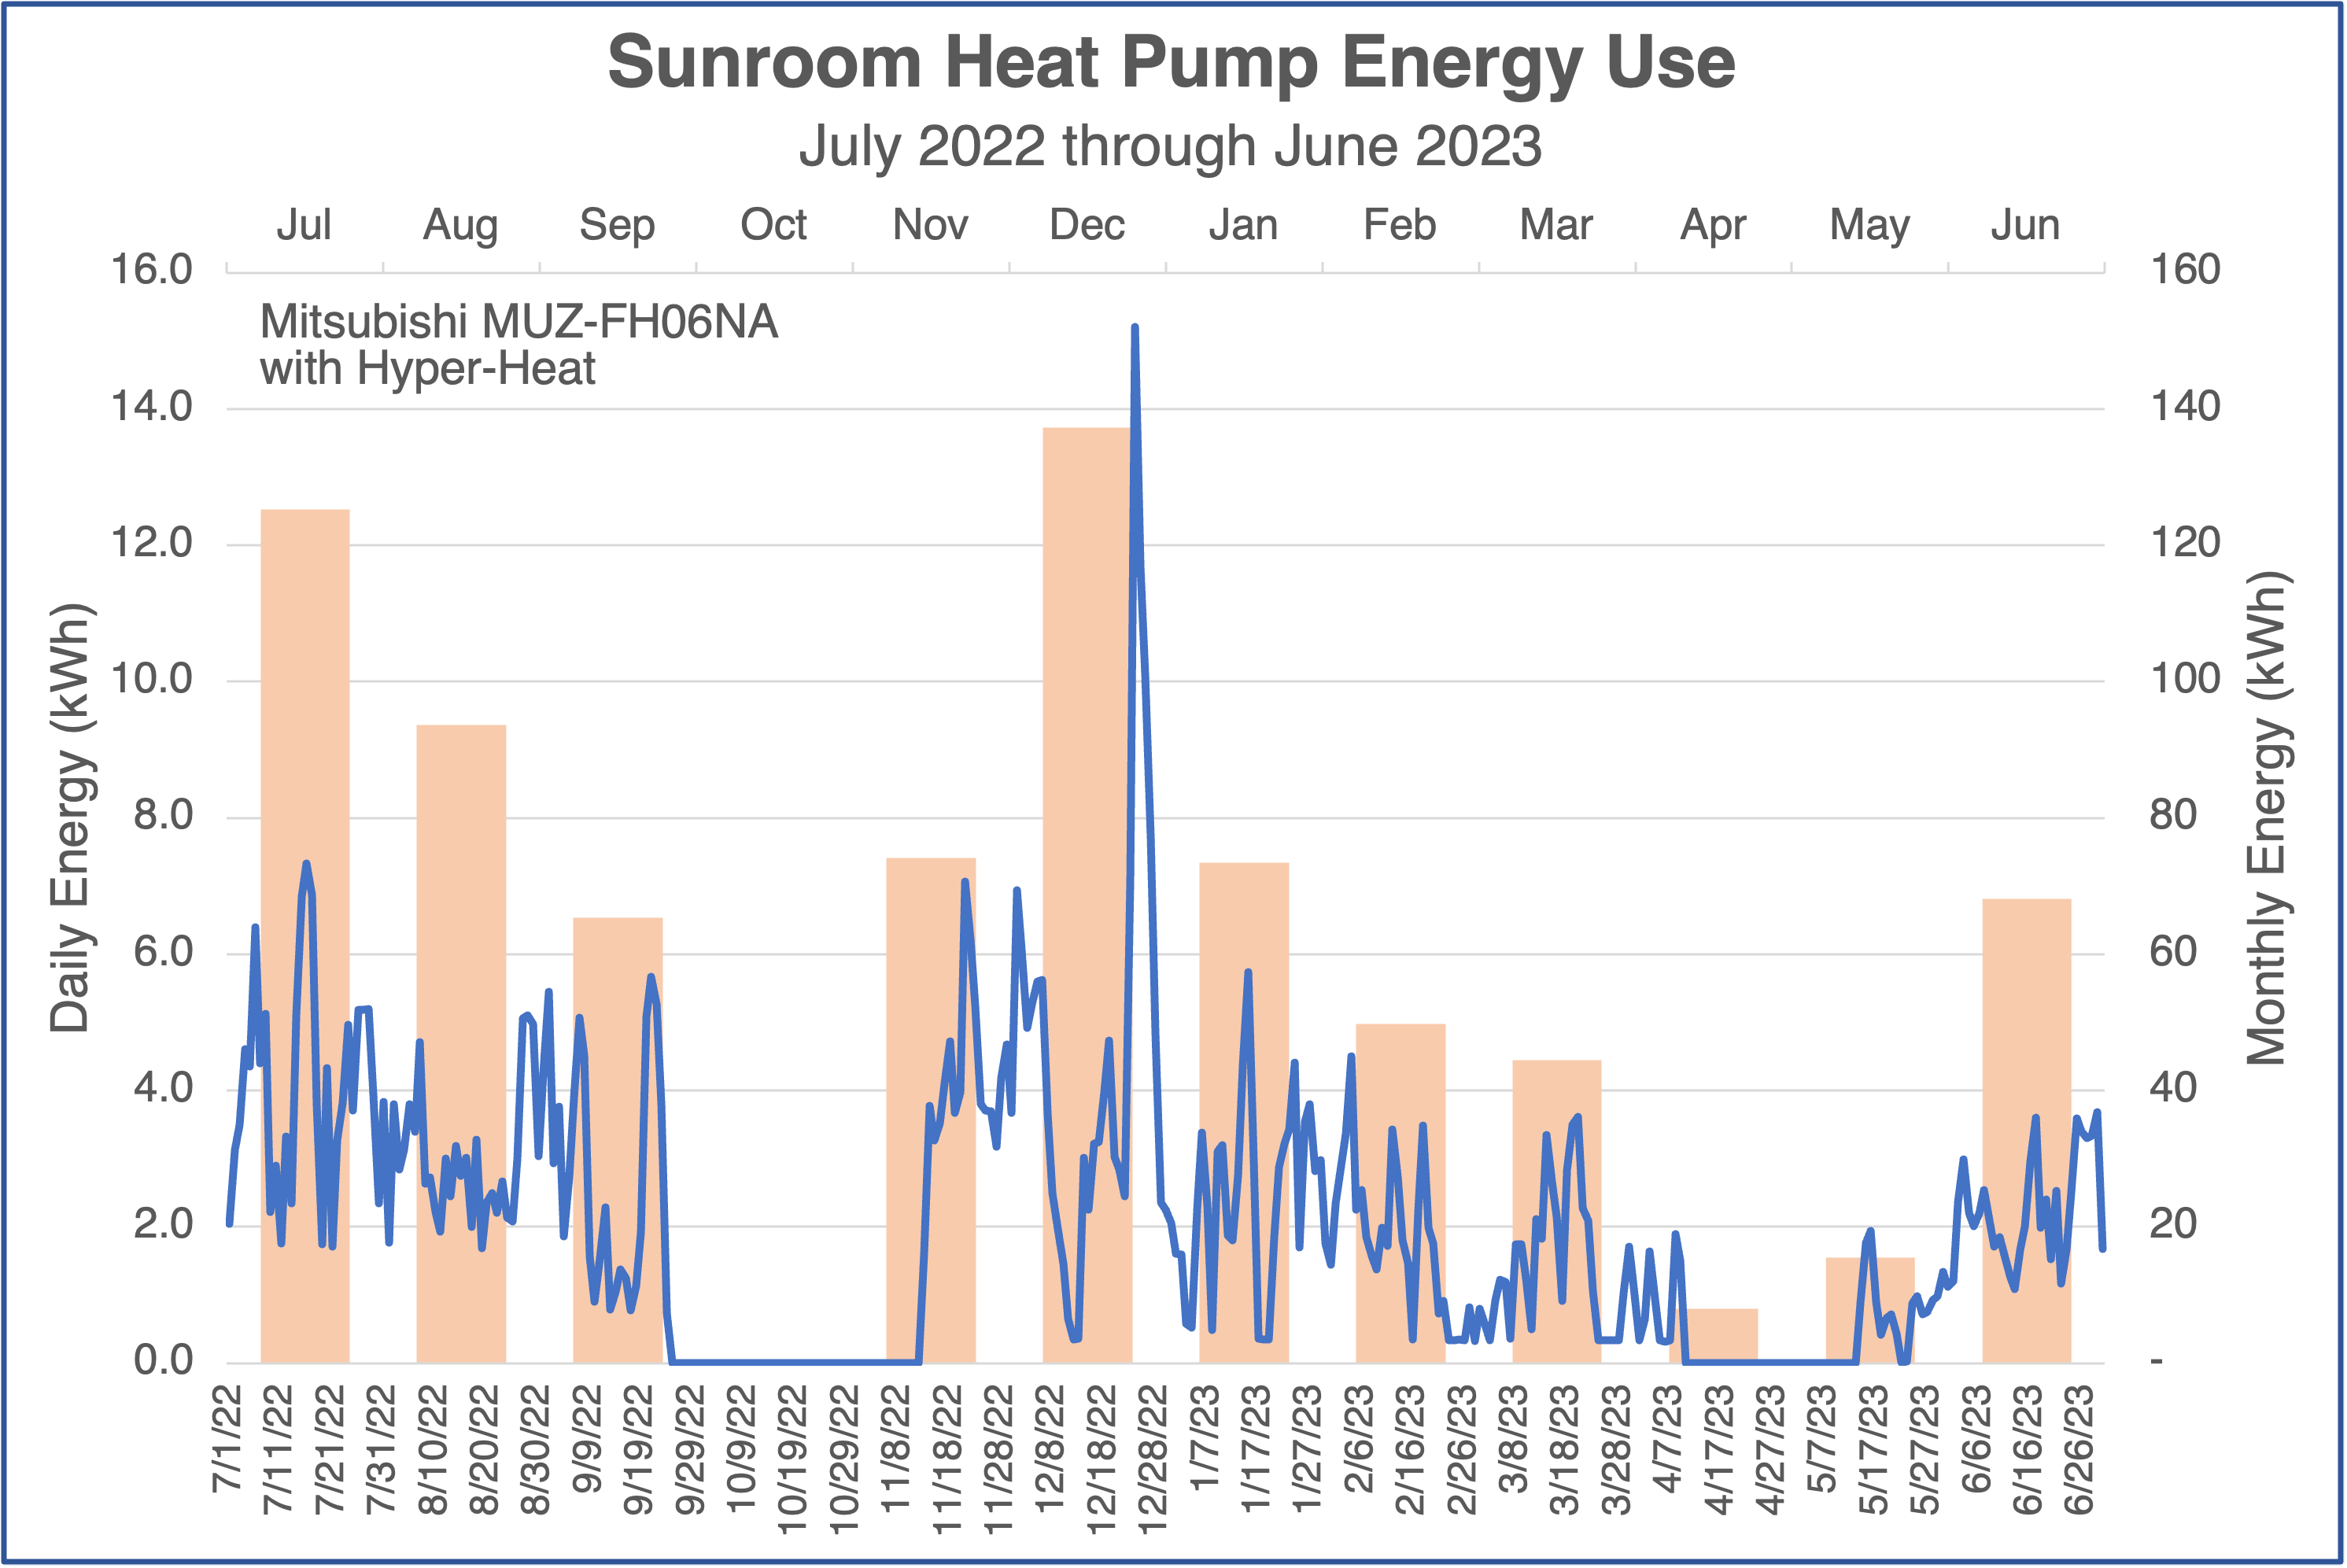
We also have a ductless mini-split heat pump in the sunroom. It uses far less energy than the big one. It’s a half-ton (6,000 BTU/hr) unit, and the total energy it used for the year was 755 kWh.
Another thing I did with the main heat pump data was to plot it along with the heating degree day data. The graph below shows that comparison, and it’s got a few points of interest.
The fall is about the only time that the heat pump curve falls mostly below the heating degree days. Also, note the preliminary spike before the biggest spike in heat pump energy. That was me pre-heating the house (thermostat at ~75 °F) before the single digit Fahrenheit arctic blast that roared through.
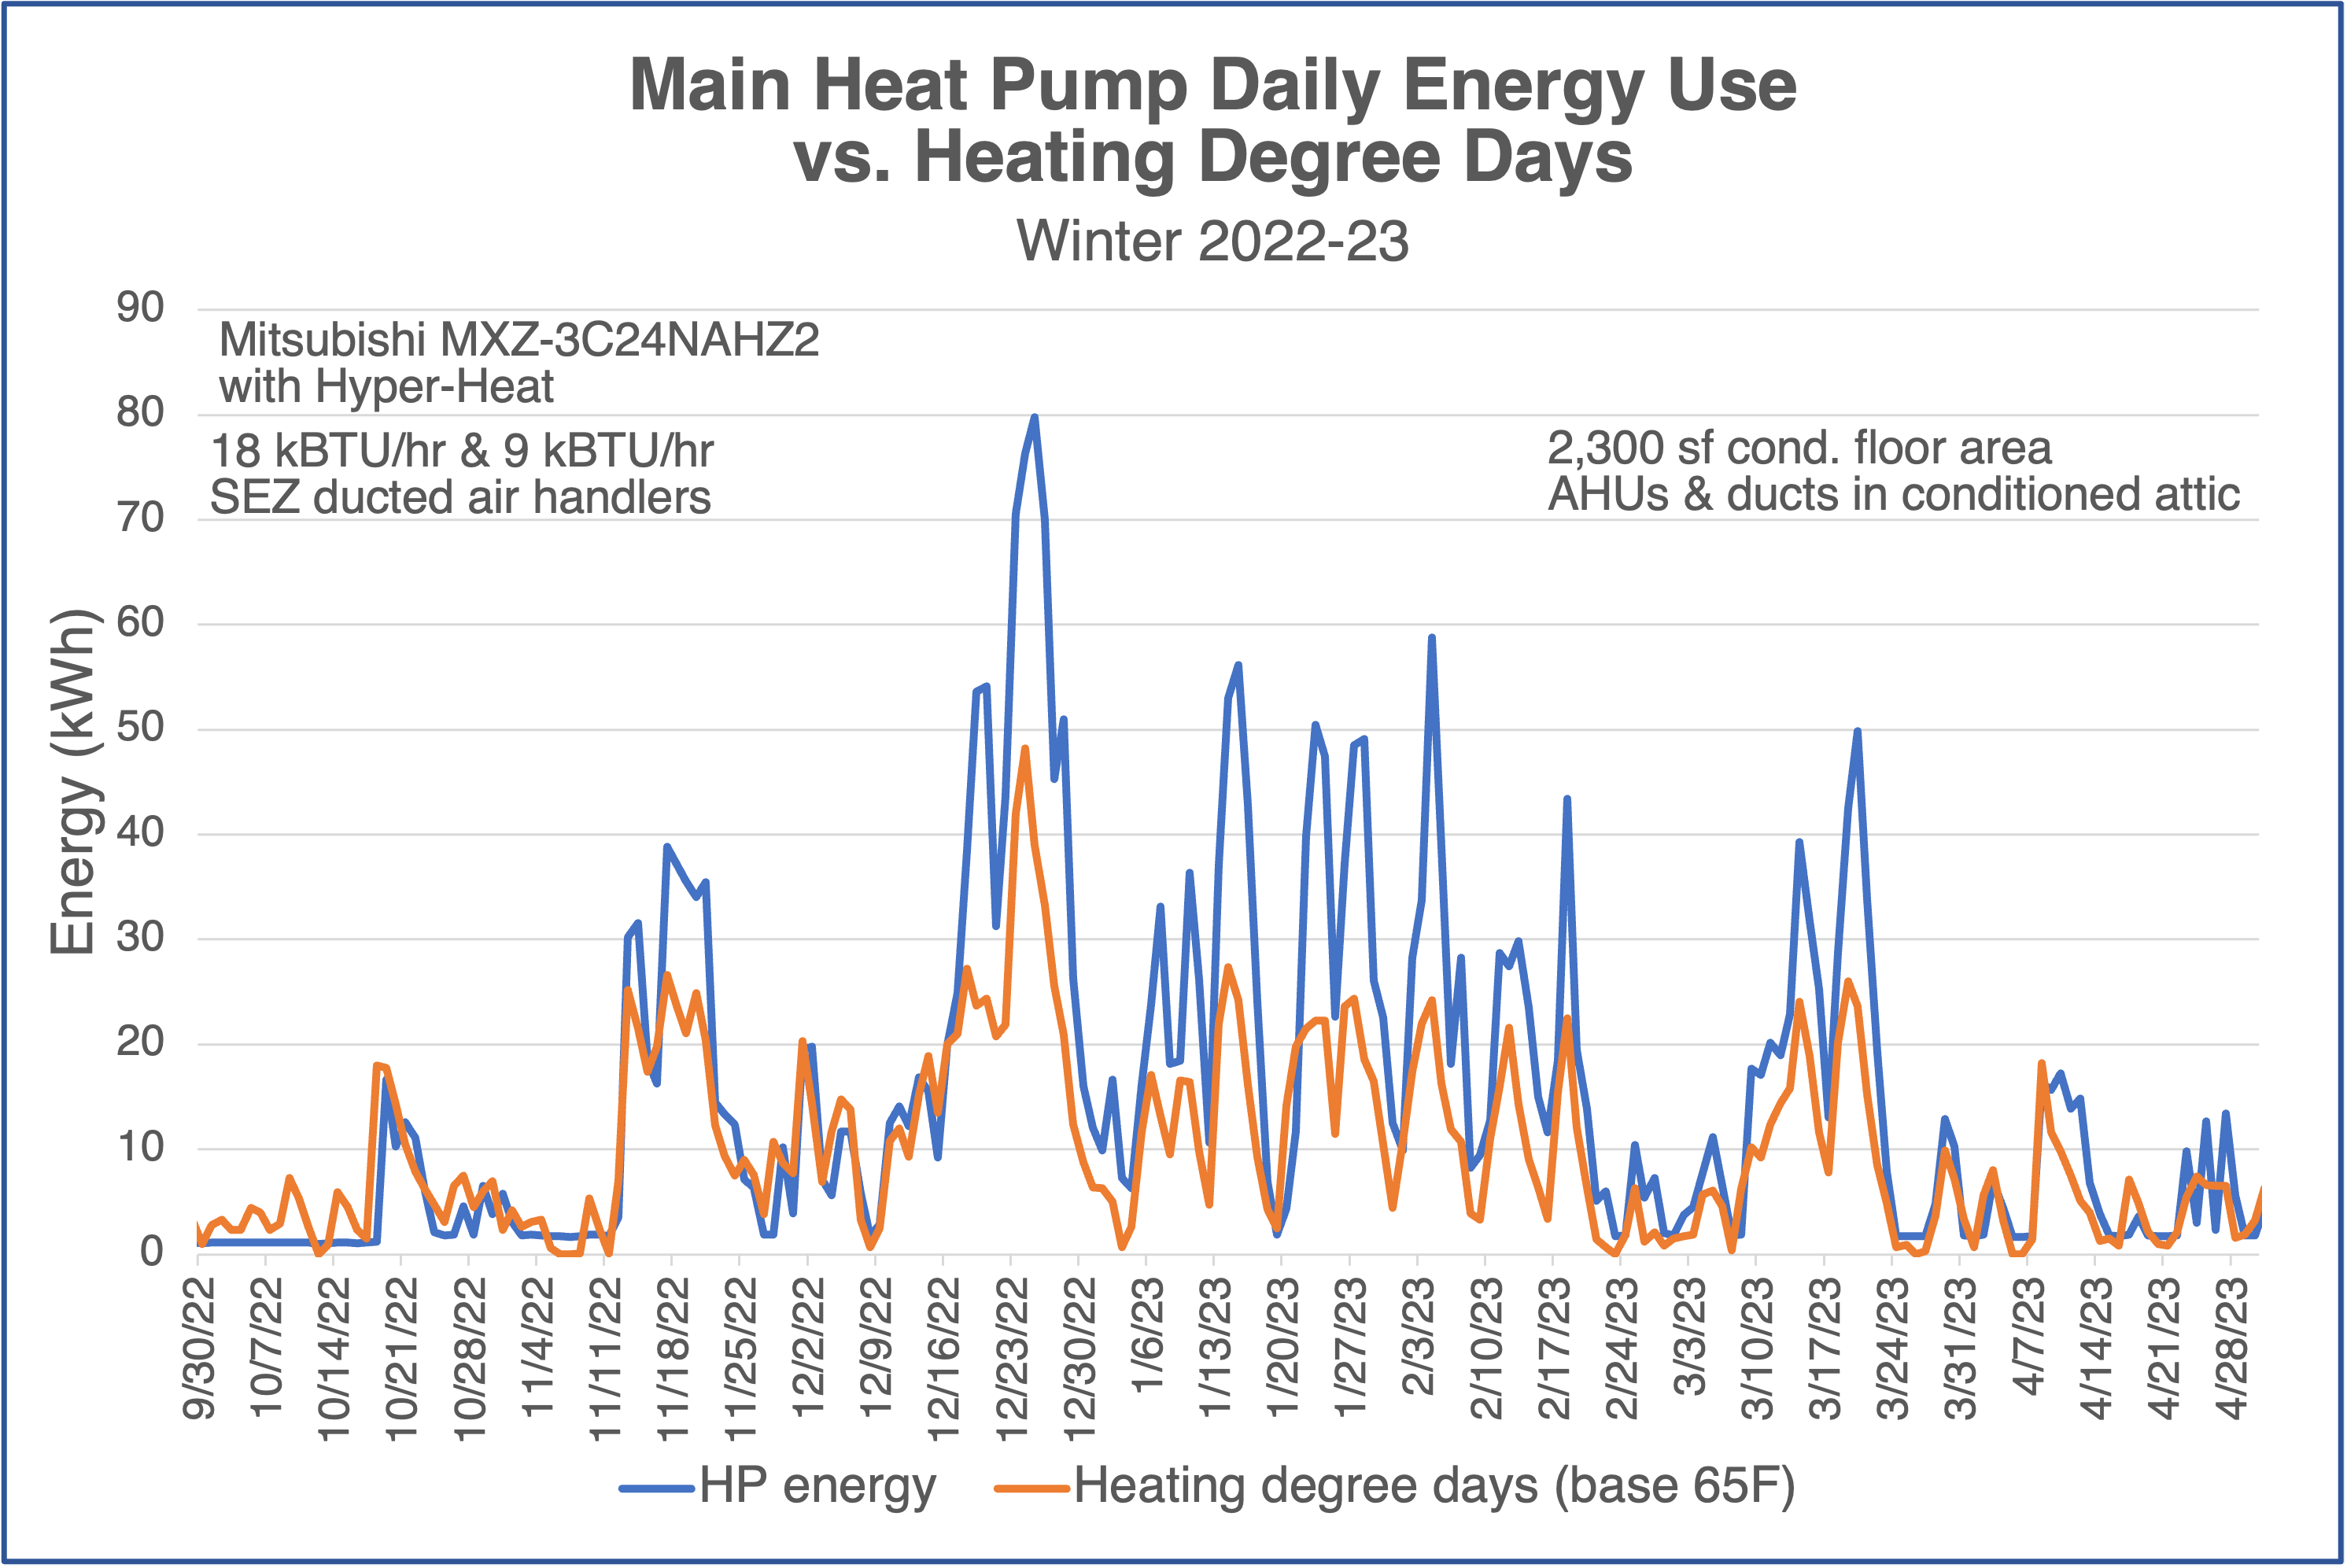
By the way, yeah, I should have added a second axis because heating degree days aren’t measured in kWh. But the numbers were close, and you’re smart enough to get it.
Base load, heating & cooling, and EV charger
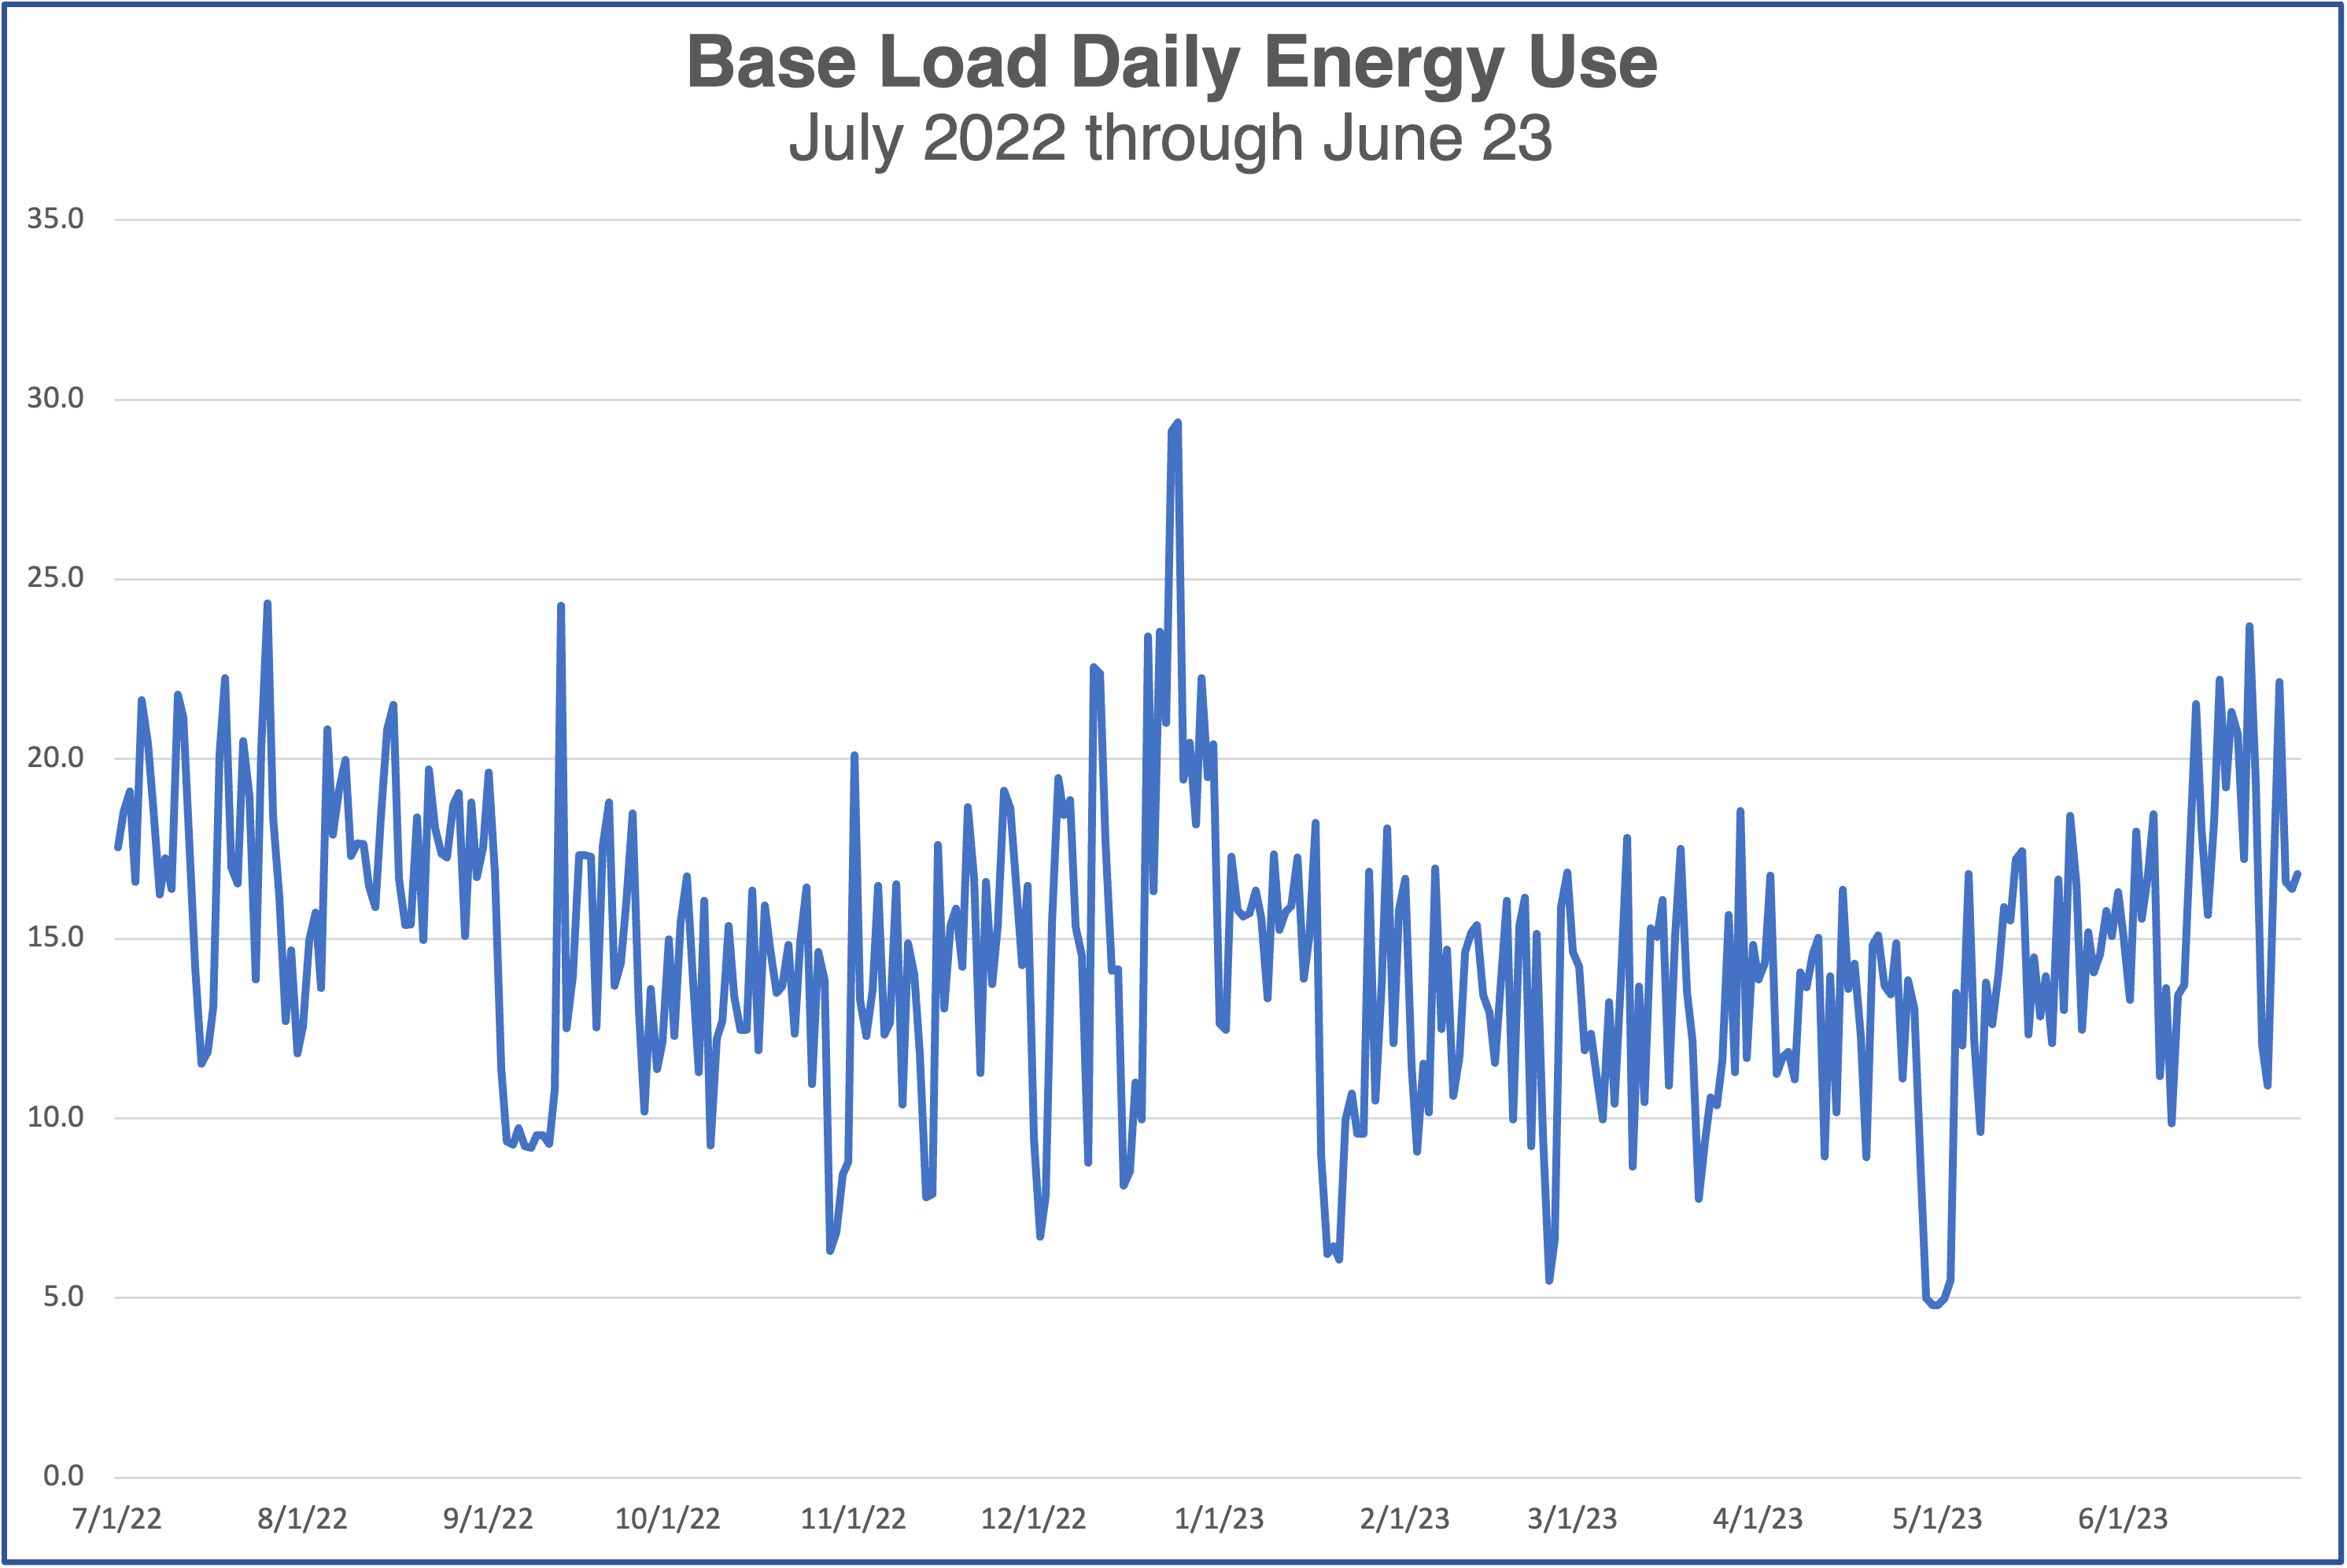
Generally, base load is all the stuff that uses energy besides your heating and cooling systems. In my case, I have a charger for my electric vehicle, so I’m not counting that as part of the base load either. Let’s begin with a look at the daily base load by itself.
Two things jump out at me. First, the big arctic blast spike also spiked our base load. We did have company at the time, so it wasn’t totally weather related. Second, our base load seems to go up in summer.
Now, let’s look at the three big components on one graph of monthly data. You can see the variation in our base load. It’s a 50 percent change from the lowest to the highest. You also can see how heating dominates in winter, and cooling is roughly equal to base load. And then there’s the EV charger, adding a bit each month, for a total of 862 kWh.
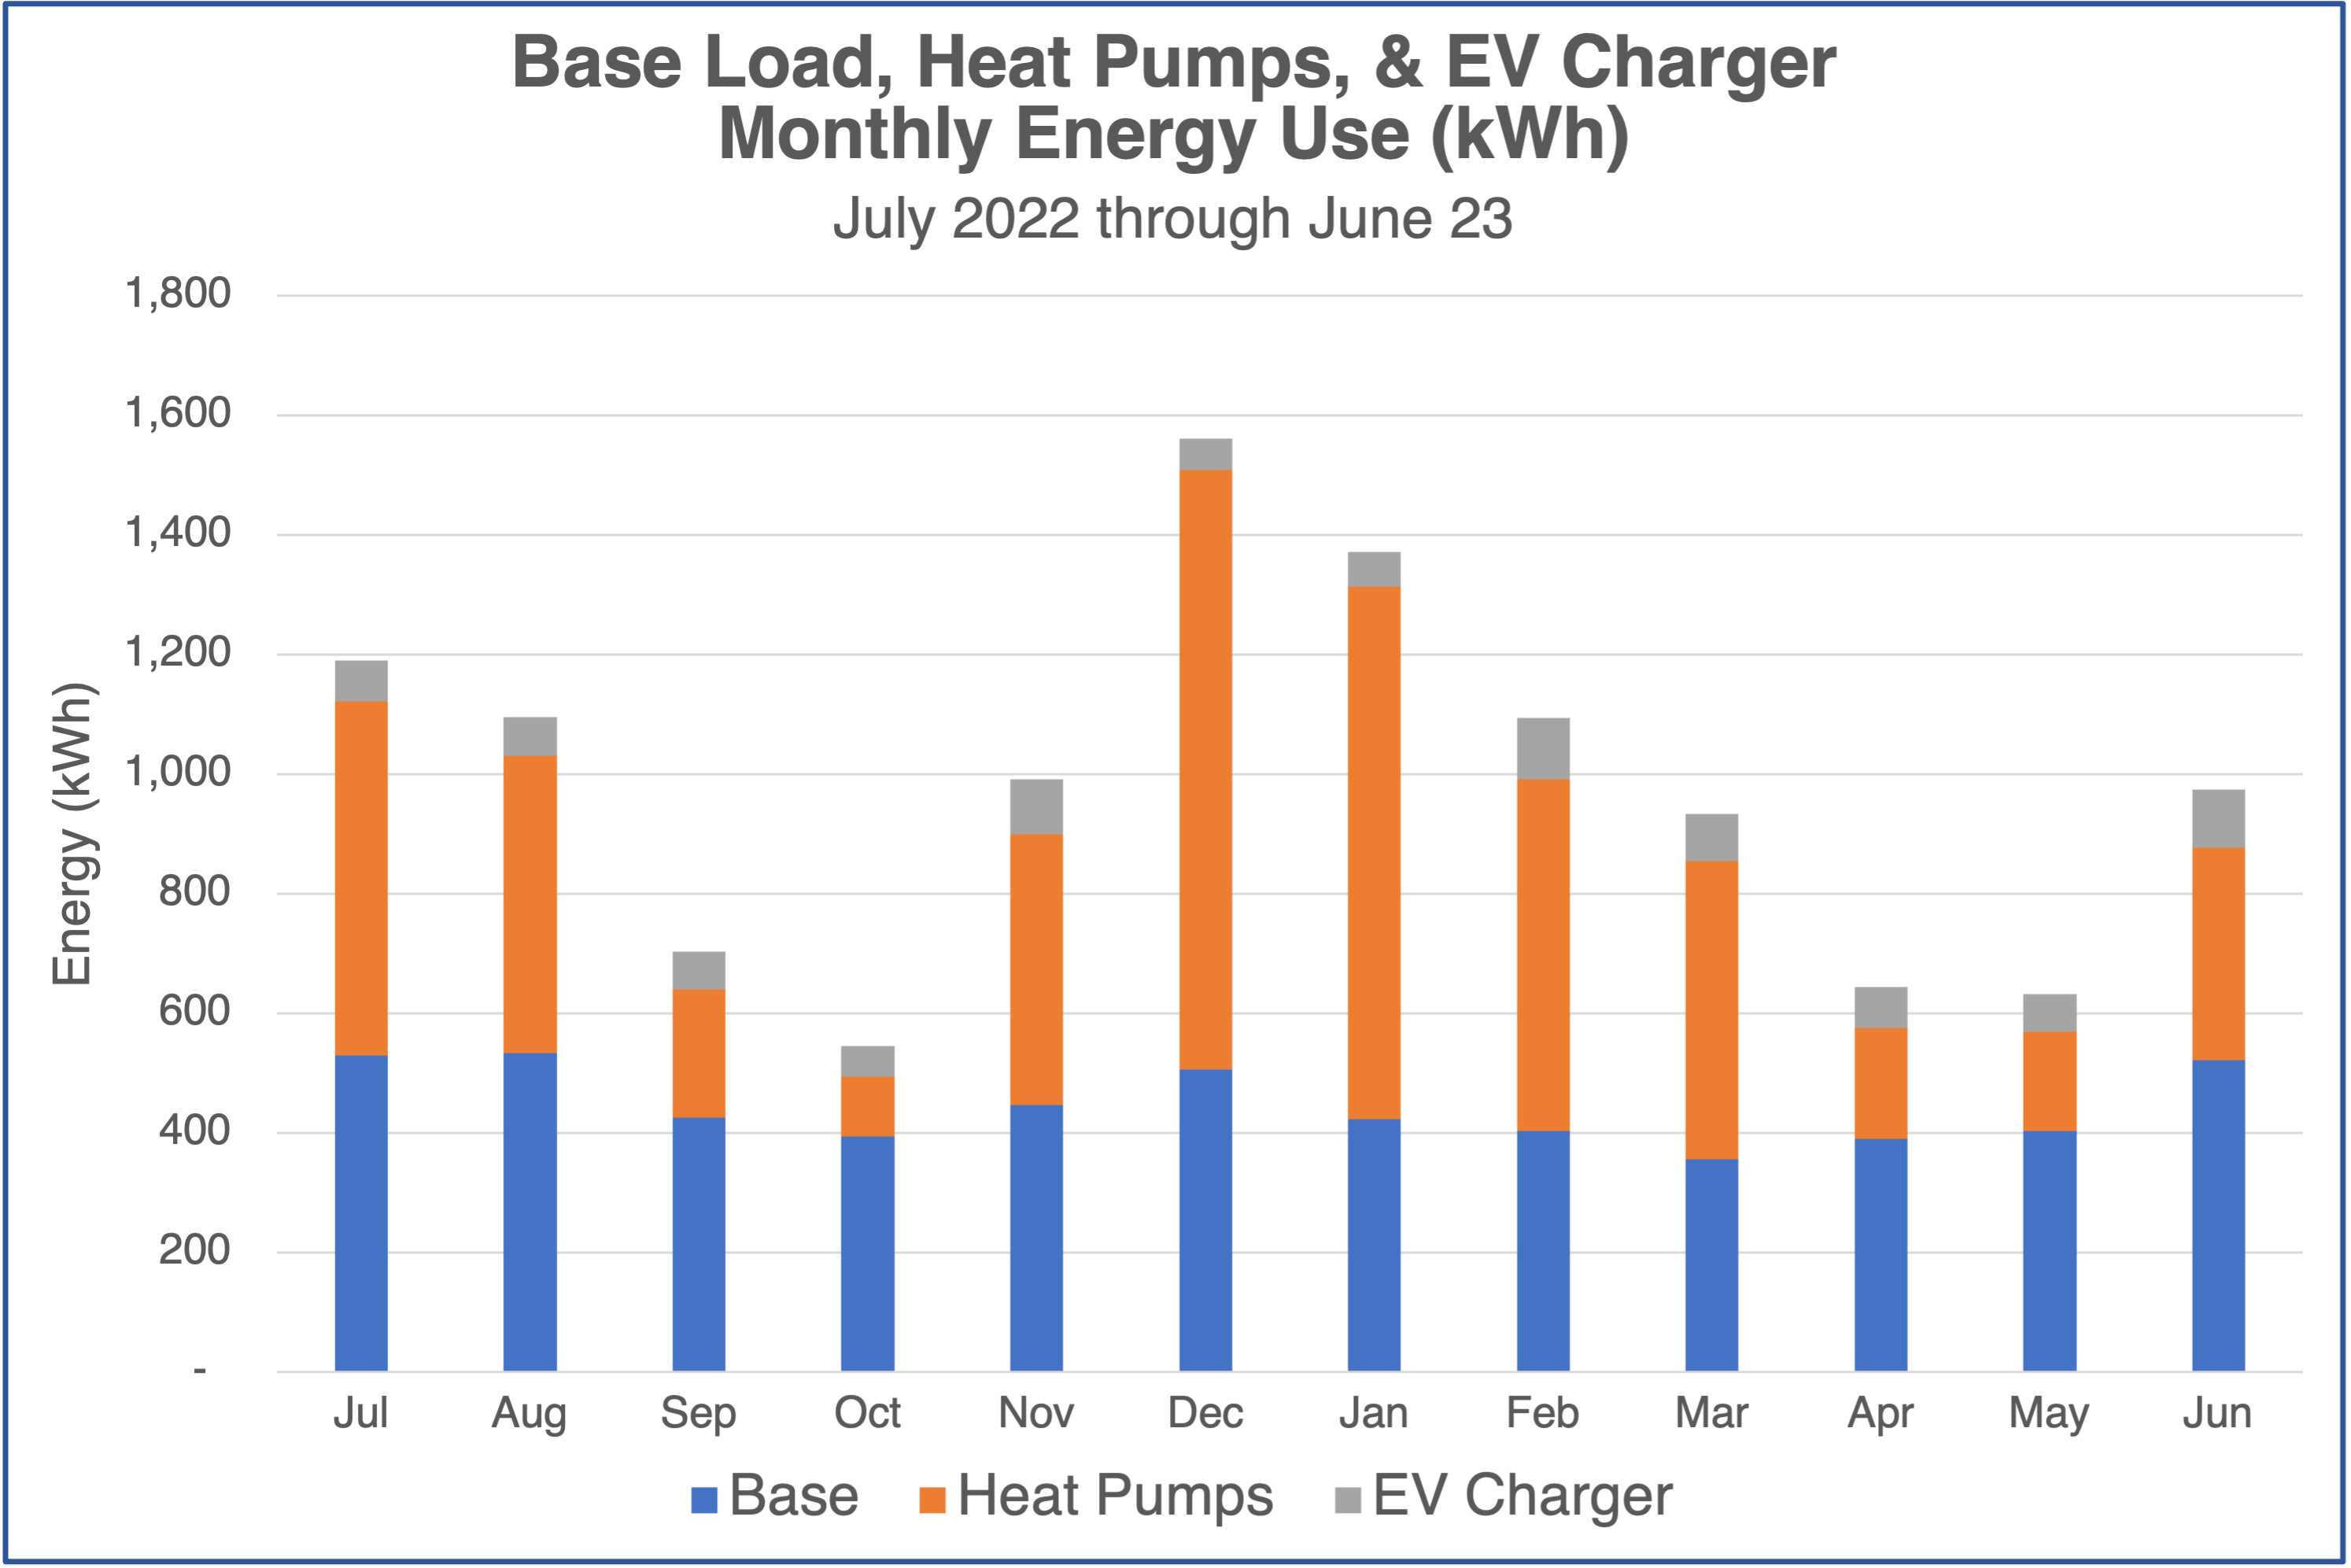
Just for fun, I plotted the same graph as percentages instead of energy. Each column adds to 100 percent.
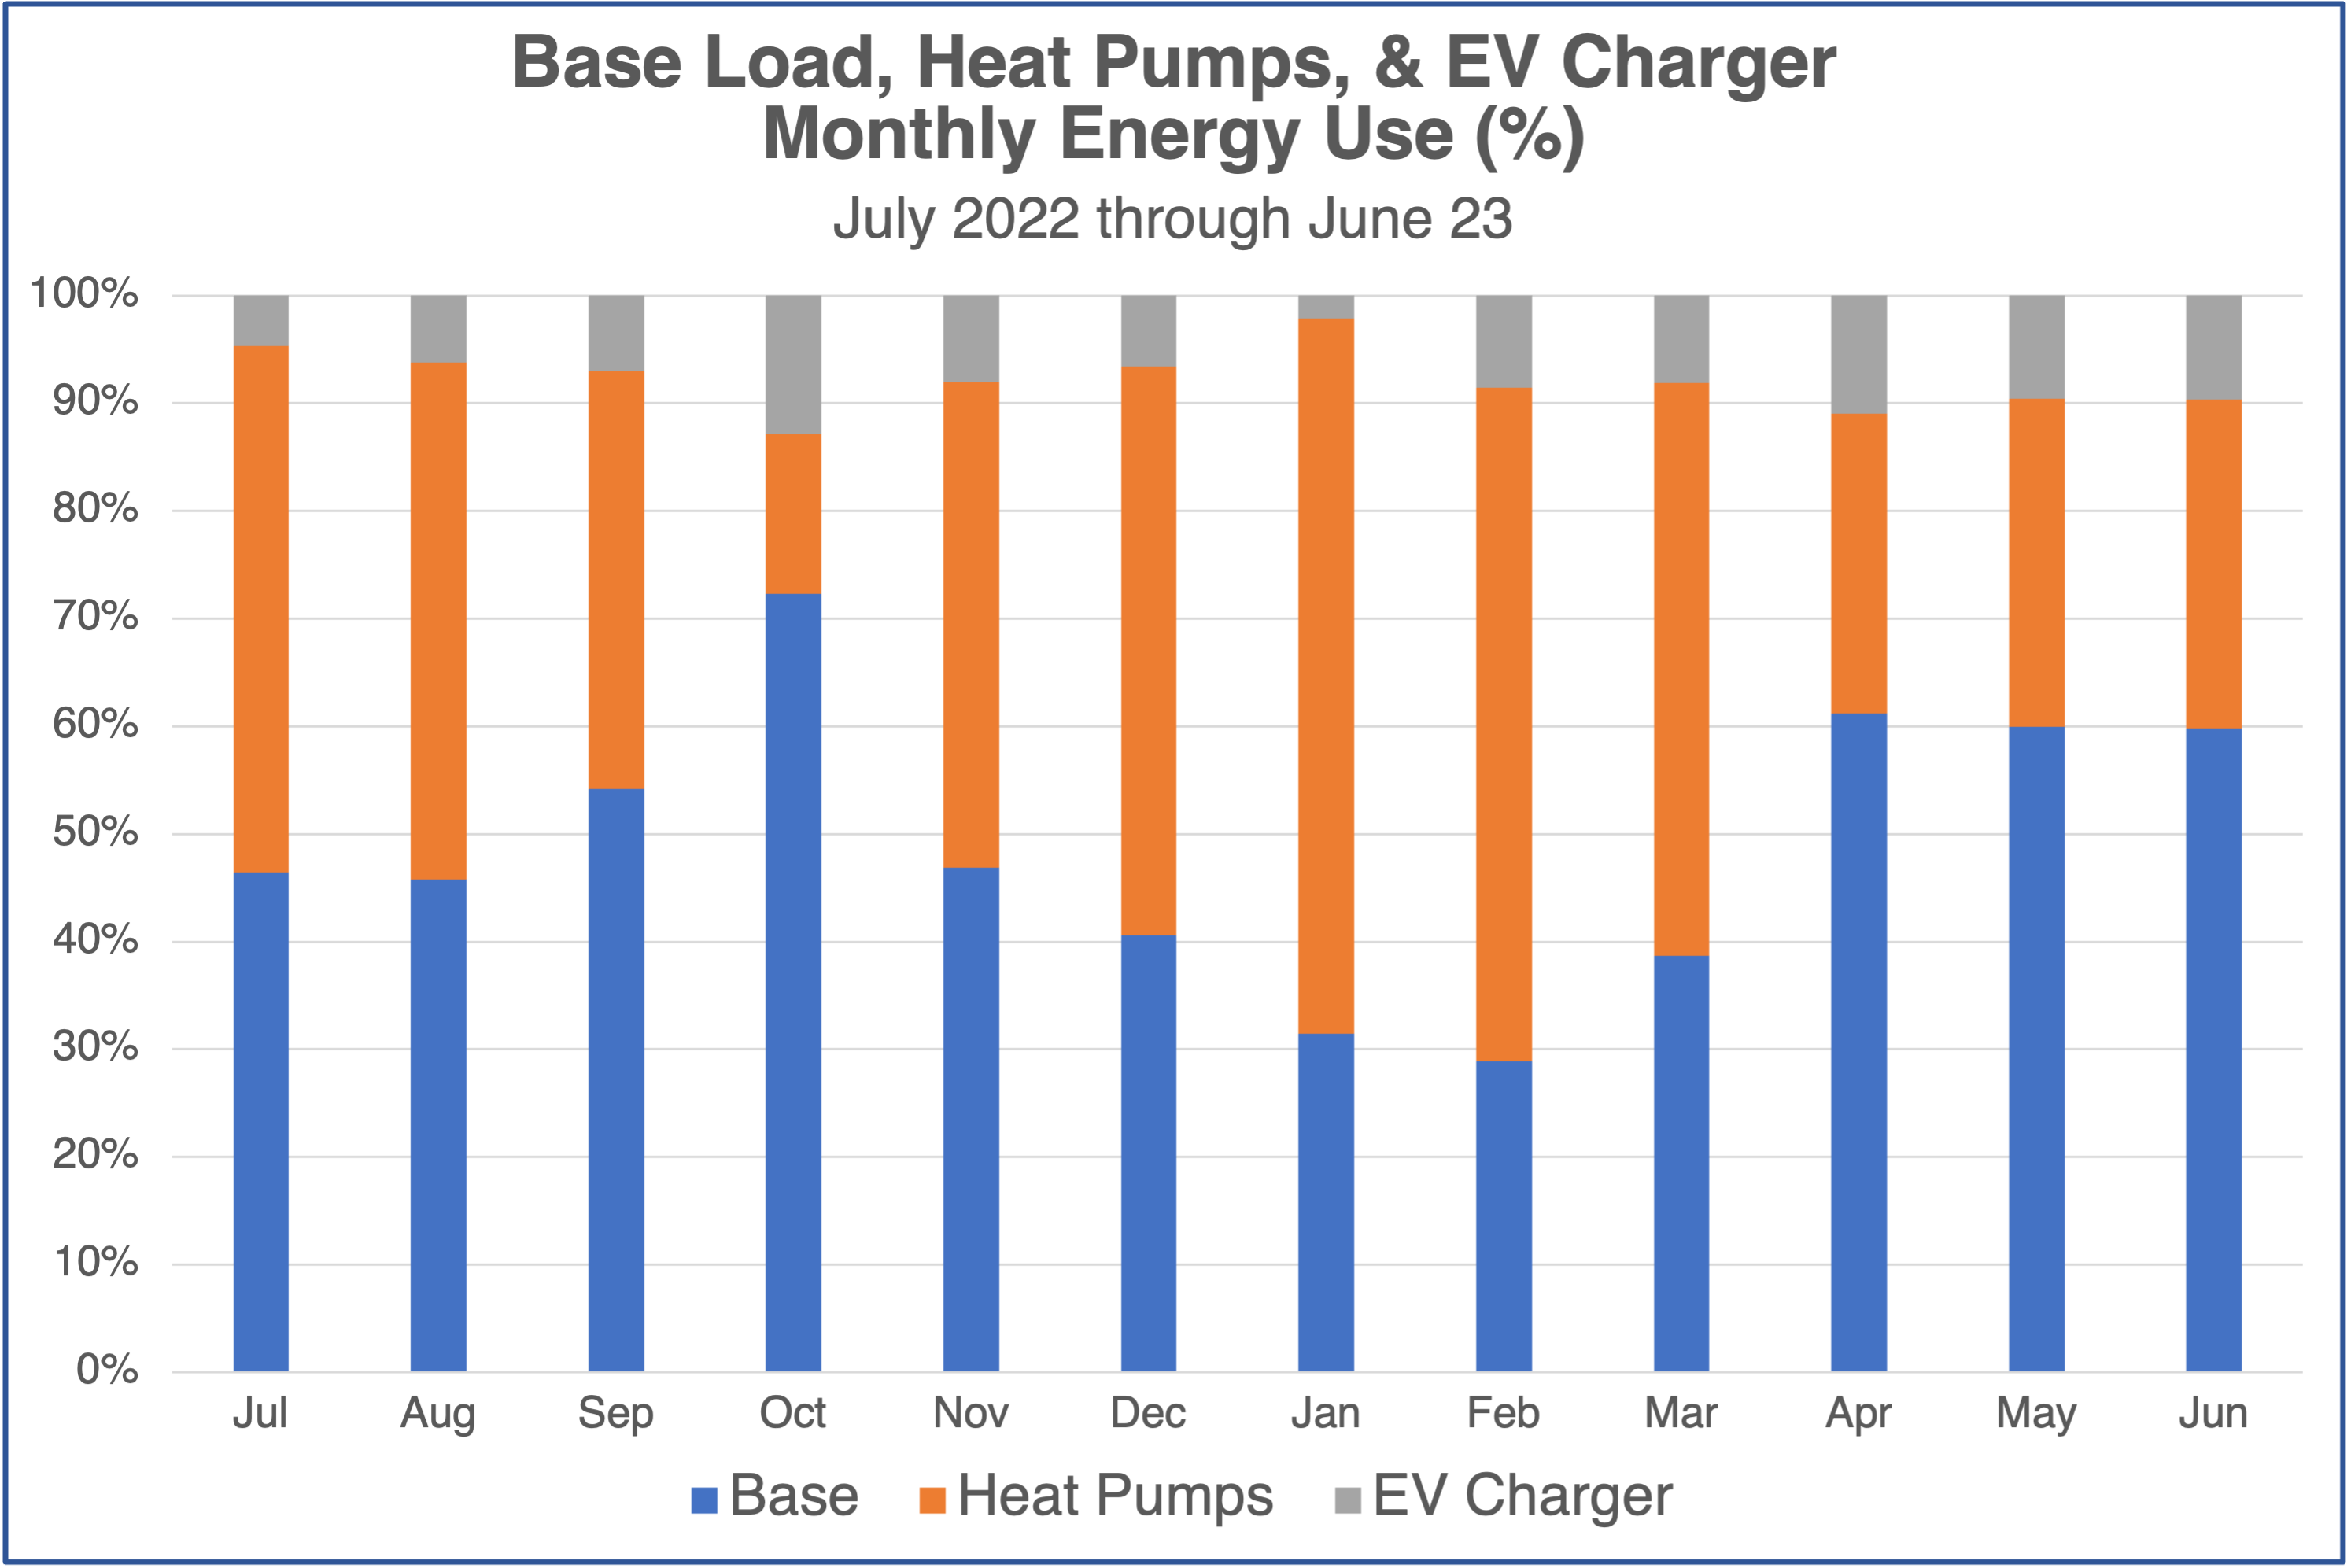
Finding the base load by actually monitoring home electricity use is easier and more accurate than trying to disaggregate it from the whole-house consumption.
Heat pump water heater
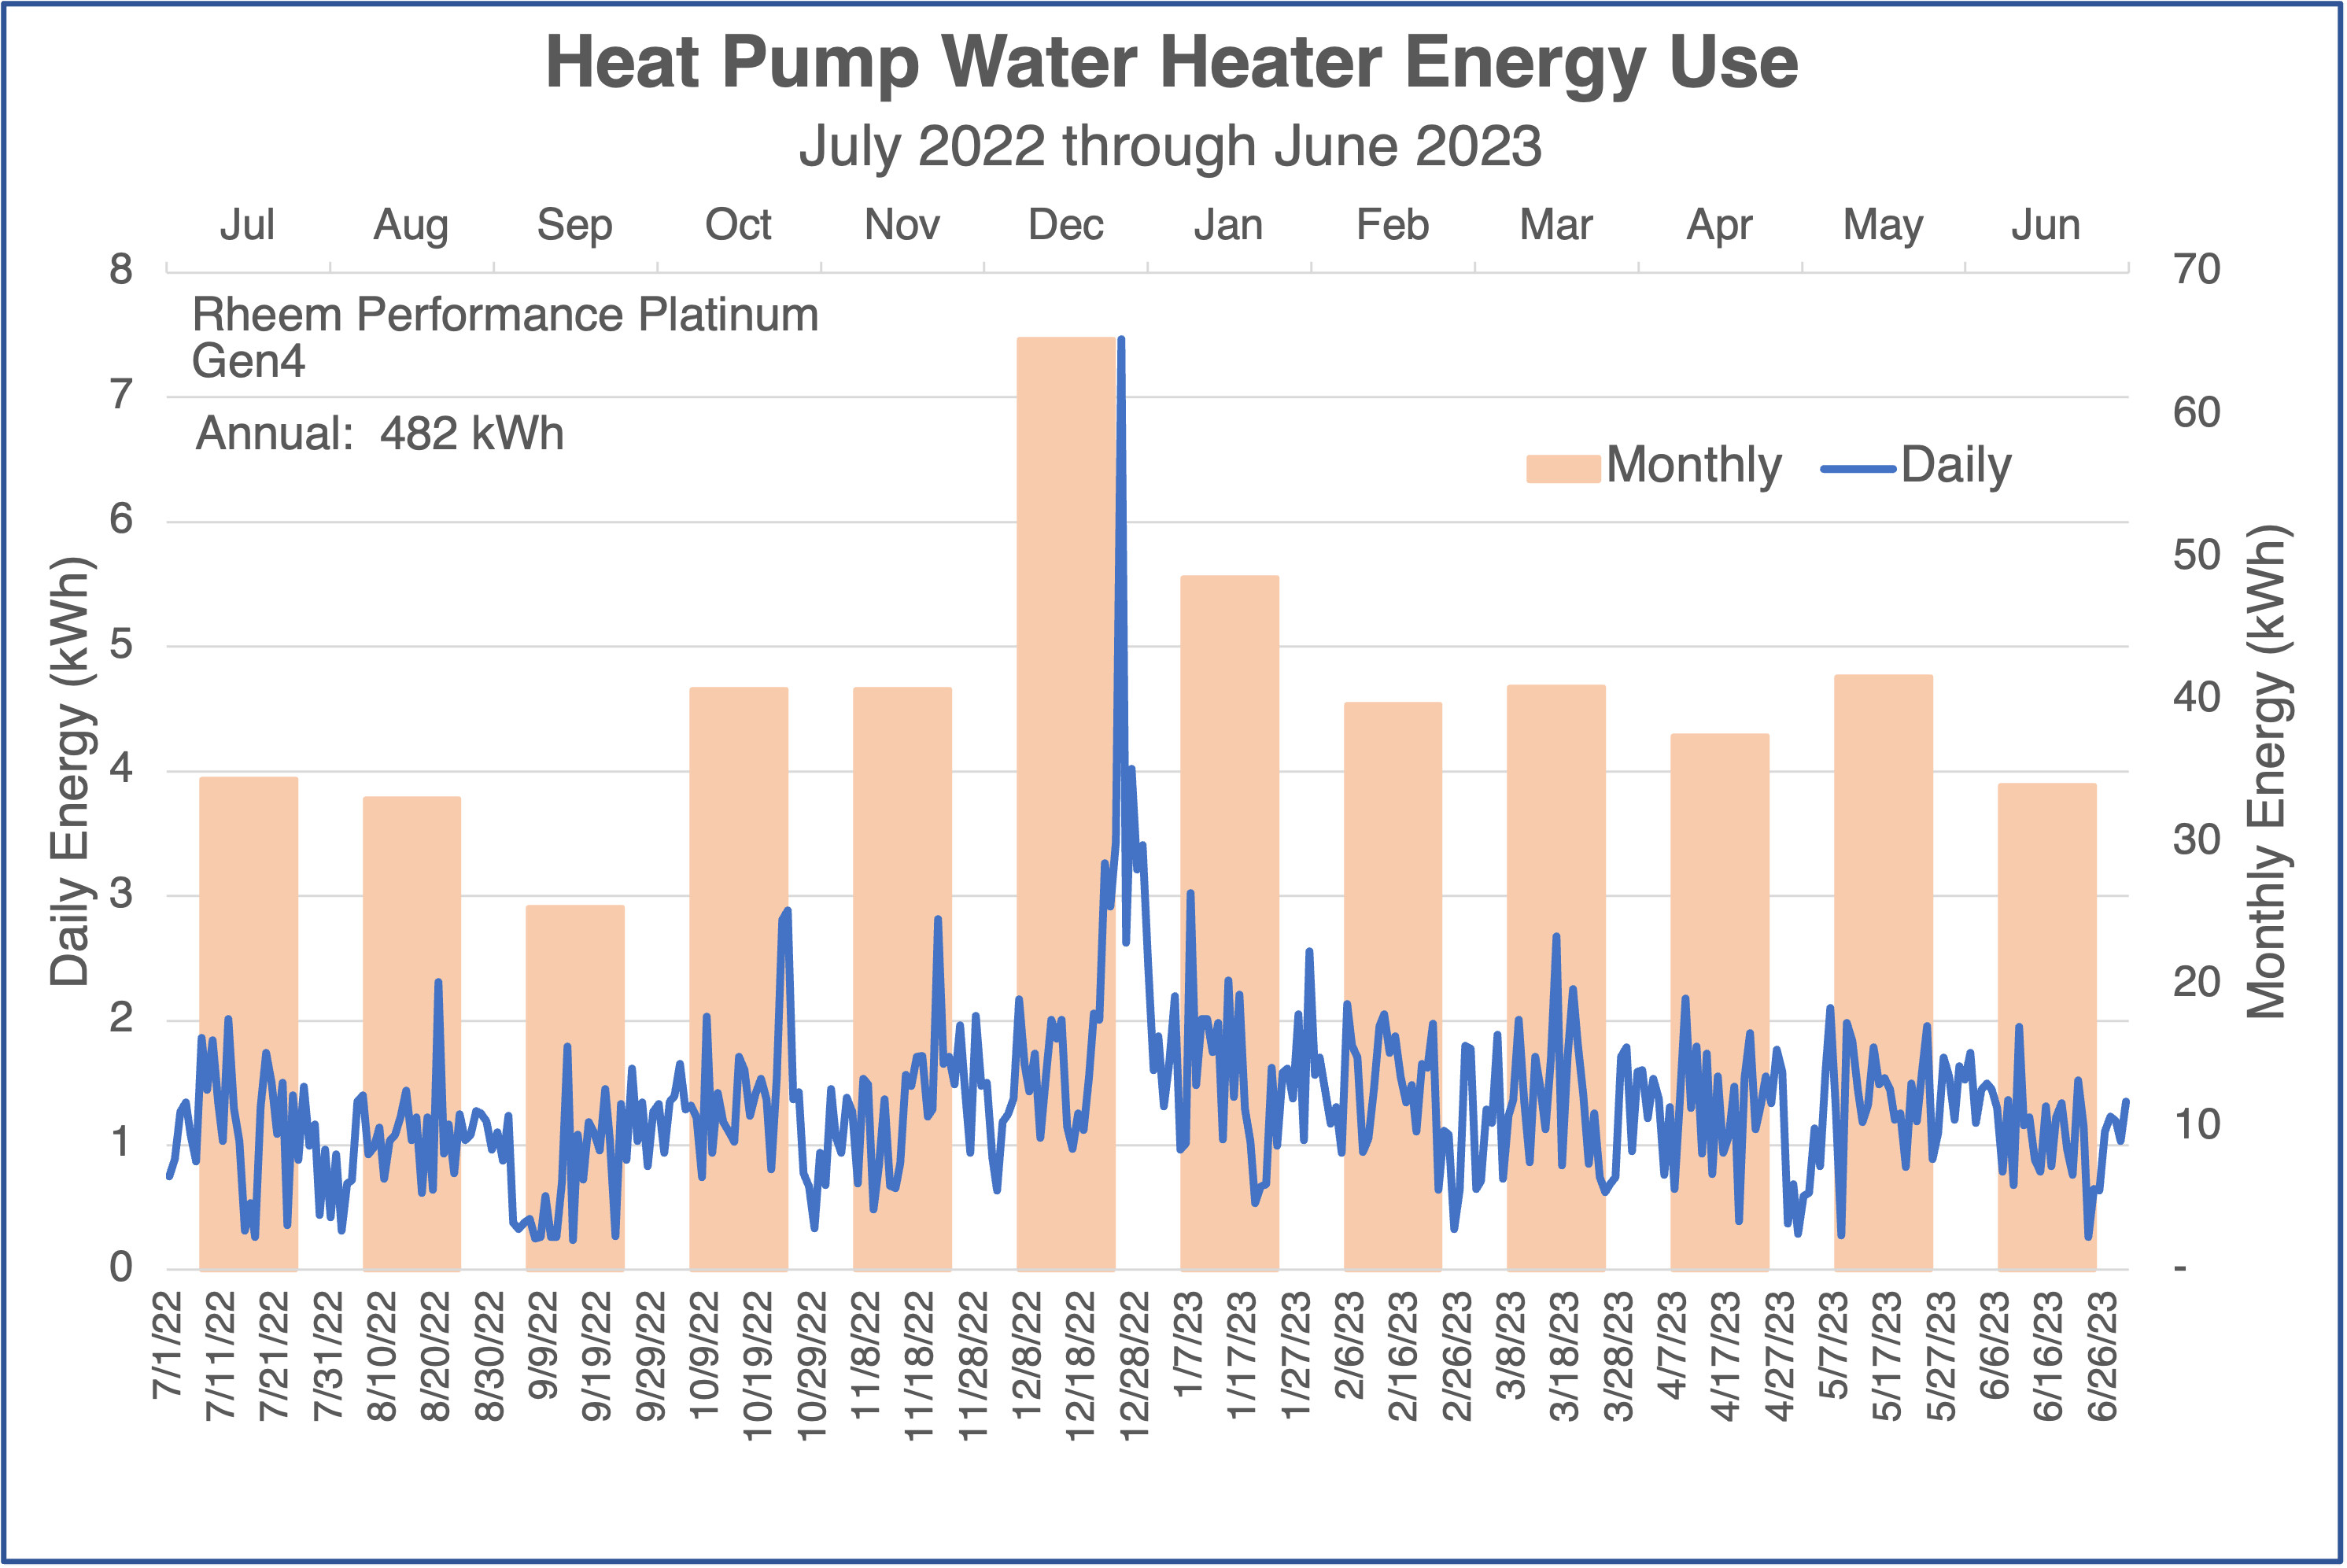
Here’s my heat pump water heater data, daily in blue and monthly in columns. The total for the year was 482 kWh. We use more energy to heat water in winter for a couple of reasons. The inlet water temperature is significantly cooler in winter, and the air around the water heater is cooler.
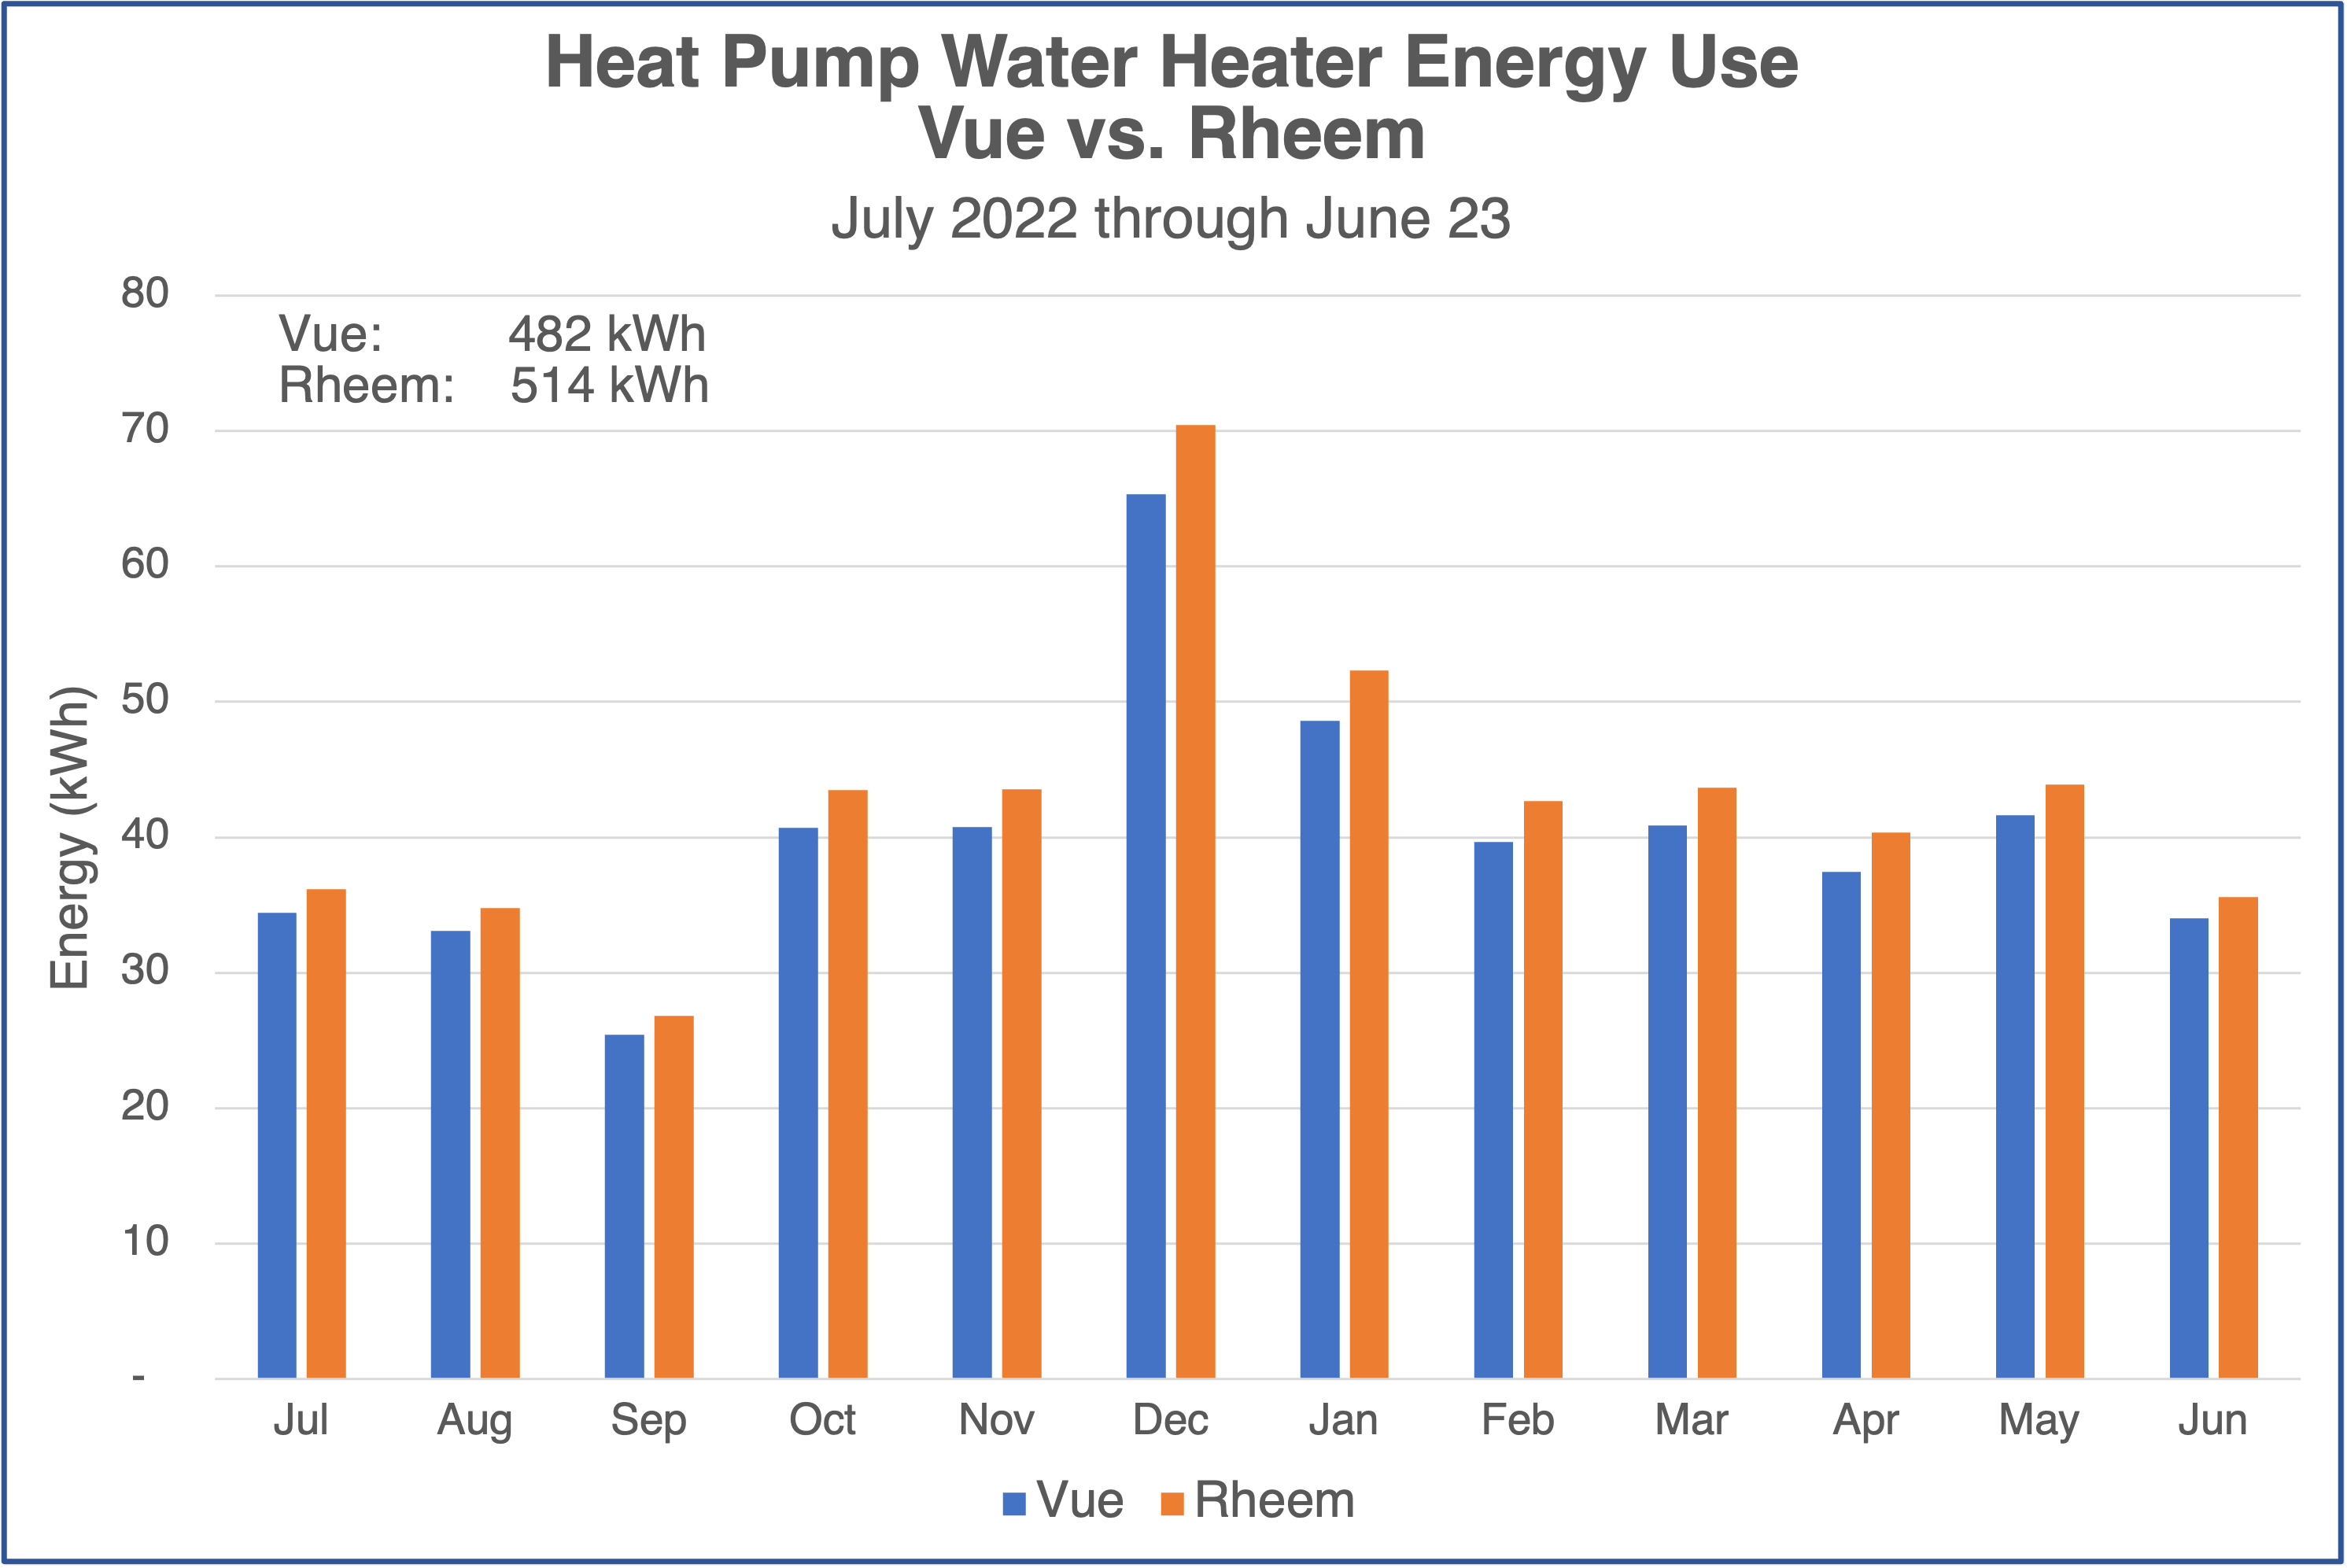
And of course you’re wondering how my Emporia Vue data compare to the data from my Rheem app. Right? The answer is below. This comparison, though, shows that the monthly discrepancies are one-sided. The Vue data are always lower than what Rheem tells me. The net effect was a 32 kWh difference, or 7 percent higher for Rheem data.
See my article on my first year of living with a heat pump water heater for more.
The gist
So there you have a quick, possibly overwhelming, look at the data for my first year of home electricity monitoring. It’s a lot, and there’s even more that I haven’t shown you. I showed graphs only of daily and monthly data here. But when you download the Emporia Vue data, you also get spreadsheets with the data for shorter time intervals: second, minute, 15 minutes, and hour. When you really want to drill down, you have the power!
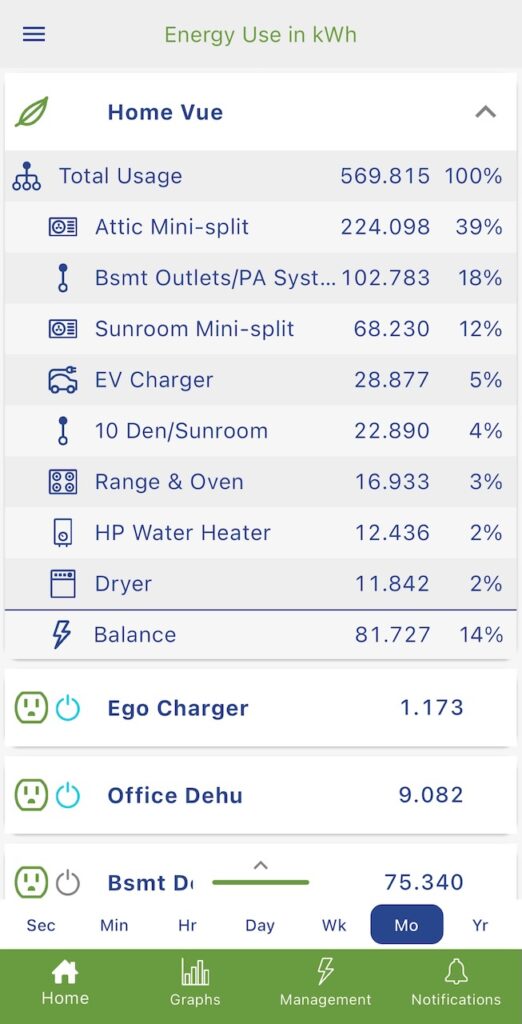
I use the Emporia app constantly. Yes, I check to see what’s happening with my energy use, but I also use it to control some devices. In addition to the Vue data, the app (shown below) also shows me the devices I have on their smart plugs.* I can turn those things on and off and also put them on schedules.
Yes, I’ve put some affiliate links in this article. You get 5 percent off if you use them to buy Emporia products,* and Energy Vanguard might make a little bit, too. But I love the Emporia Vue and smart plugs.* I’d say that even without the little bit of affiliate income we get when people use them. (We’ve made $102 so far this year, in case you’re interested, so it’s a tiny fraction of Energy Vanguard’s income.)
The gist here is that we’re living in the golden age of monitoring. We have great devices that can tell us how much electricity we’re using, what’s in the air we’re breathing, and how many flights of stairs we’ve climbed. If you’re not monitoring electricity yet, why not?
Allison A. Bailes III, PhD is a speaker, writer, building science consultant, and the founder of Energy Vanguard in Decatur, Georgia. He has a doctorate in physics and is the author of a bestselling book on building science. He also writes the Energy Vanguard Blog. For more updates, you can subscribe to the Energy Vanguard newsletter and follow him on LinkedIn.
Related Articles
Introduction to Whole-House Electricity Monitoring
Living With a Heat Pump Water Heater
The #1 Reason to Have an All-Electric Home
* This is an affiliate link. You get a 5% discount on Emporia products when you use it, and Energy Vanguard may make a small commission if you buy after using the link.
Comments are welcome and moderated. Your comment will not appear below until approved.
This Post Has 33 Comments
Comments are closed.

I’m still monitoring 32 years of data and counting. The last three years, we haven’t exceeded 700kwh in any month.
Danny: You have a great case study with all those data! That’s why I included it in my book. Have you added any other monitoring?
Very cool data.
How do you interpret the heating degree days relationship with the KwH energy used? Units aside (and that might be a mistake) the blue line seems to be above the orange line when both are high. Is that implying that efficiency drops when it is colder? ie this is CoP at lower outdoor temps (exacerbated by your intentional undersizing? Not that this is a bad thing, necessarily, just got me curious 🙂
Perhaps plot that as a ratio between hdd and KwH used?
Might be worth adding in a baseline of KwH that would be used by resistance heat (ie just the KwH needed to match between HDD and design temp, given your Manual J. Hmmm, perhaps harder than I thought 😉
James: The quick take on kWh vs. HDD is that the heat pump uses more energy when it gets cold outdoors. I also mentioned above that the first cold snap in October seemed to require less heat per HDD. I did graph the ratio of HDD to kWh but didn’t see anything of much interest there.
There’s no auxiliary heat in my systems, so there’s nothing to show there.
Interesting. Was the ratio was essentially flat? Shouldn’t it vary as CoP decreases when it is colder outside?
James: The beginning had lots of high peaks because it got cold and the heat pump didn’t have to do much because the house was still warm. Through most of the heating season, it was flat with occasional spikes. I don’t know what the spikes were about, but they may have been times when we were out of town with the thermostat set back.
How about oil return? IDK exactly how your unit works but my Daikin Fit will spin up to max compressor speed for oil return. IDK how often it happens but I feel like I see it more with heating. I’m unsure how much power it actually pulls but if it had to run more on certain days that might account for that. My Daikin Fit apparently cycles the compressor a little bit during cooling, possibly heating. I haven’t witnessed it but supposedly it goes through a few cycles an hour? Maybe that has to do with dehumidification.
If my understanding is correct, your winter indoor is 75 Fahrenheit. That is very high – 24 Centigrade. In contrast, Europeans would keep it 21-22.5 Centigrade or 70-72.5 Fahrenheit. We also rely more on stone as a construction material.
Best,
Roderick.
75° Fahrenheit would be high. However, Allison said he was “pre-heating the house”, so this must have been a temporary increase designed to use the house itself as a “heat battery”, The stored additional heat would help carry the house through the impending severe cold weather.
You may be right that 75F was a temporary target.
But I think the energy storage idea is simply wrong. If your target is 72, you set the thermostat to 72, not above. A furnace is either on or off and does not generate more heat at a higher temperature target. Furthermore, American wood houses have little thermal mass unlike the 19th century European buildings in which my properties are located.
Roderick: Yes, that was a temporary setpoint to pre-heat the house as the arctic blast was bearing down on us. My target wasn’t 72F. It was to get the house as warm as I could because I hoped it might help delay the impending struggle to keep the warm.
Regarding your statement about furnaces being on or off, that doesn’t apply here, for two reasons. First, I don’t have a furnace. Second, our heat pump has variable capacity, which means that it will run more when I set the thermostat higher.
Your point about thermal mass is true, but we do have brick veneer so that helps some.
That brick veneer may help or hurt more then you think. I havent seen any actual studies on heat retention other then people saying “it hold heat very well.” I have a brick house and I’ll tell you right now that during the summer my max heating load is still 2-4 hours AFTER the daily max OD temp. Even on cooler summer days of say 80F degrees my brink is still a sweltering 130F. House built in 1972 and walls are R11 or R14 at best.
I always thought that winter heat costs more was because delta T is greater in the winter.
Bruce: Yes, that’s the main reason we do more heating than cooling, even in places where people believe the opposite. I don’t think I said anything in the article to contradict that, did I?
Allison, I use my Energy Vanguard many times a day too. It makes up a little for the total lack of feedback from my mini-split HP. When the room temperature is 6 or 8F above setpoint I wonder if the heat pump is reacting to room temperatures or not. Checking the power draw is reassuring or sometimes surprising when it is drawing almost nothing (what is it doing?). When I saw your annual kWh use of 11,778, I gasped, then did a calculation of your total annual BTUs and found it’s a lot less than mine, and your conditioned area is larger. I am using gas heat most of the time still, so my electric use is quite low at about 300 kWh/ month, but with our gas + electric use the total is 38.9 kBTU/SF-year. Moreover, we buy gasoline for our hybrid car that is not included in these totals. So congratulations on you EUI of 17.4 kBTU/SF-year, including your car! That’s certainly low enough to be offset by a rooftop solar array. I am using 8 smart plugs to cut down on unmonitored loads now. That reduced my balance of unmetered things from 50% to about 20% of the monthly use. Lights and minor plug loads make up the remaining balance of loads. I find it a bit surprising that our two laptops and routers are using 15% of our monthly use; I expected it to be smaller. Our refrigerator only used 20% of the total in April-May-June, so our computer gear rivals that at just under 70 watts continuously.
Gene: I’m happy you use your Energy Vanguard so frequently! Or did you mean your Emporia Vue? :~)
Yes, our EUI (Energy Use Intensity for those wondering) is ~5 kWh/sf/yr, or ~17 kBTU/sf/yr, as you calculated. I meant to put that in the article, so thanks for bringing it up here in the comments. And yes, we can cover our use pretty easily with PV modules on half or less of our south-facing roof.
I have 4 smart plugs going right now but will probably add more. I need to put the dishwasher on a plug instead of being hard-wired so I can monitor it, too.
Yes I did mean Emporia Vue but didn’t notice until after I had sent my email comment.
Any AUX heat usage? Here in NE FL we made it through that cold streak with the heat strips locked out. The unit ran nearly 100% duty cycle at night and did a lot of huffing and puffing every 30 mins for defrost. But it maintained our set point and didn’t spin our power meter completely off the wall. Worst 24hr period was 47kWh — roughly equal to a typical day in July.
I wish the HVAC trade would stop setting these to engage aux at 35F.
RM: Nope. I’ve got an undersized heat pump with no auxiliary heat. You can read more about how we fared in both hot and cold weather above our design temperatures in these articles:
My Undersized Mini-Split Heat Pump in a Heat Wave
My Undersized Heat Pump in an Arctic Blast
Even worse than setting strip heat to come on at 35F is when people who should know better tell homeowners to set their thermostat to “Emergency Heat” whenever the temperature drops into the 30s Fahrenheit.
The Emporia Vue Gen 2 3-phase includes CT sensors that lack the expected accuracy for monitoring. The 200a CT is 5% and the 50a CTs are 2%. Standard instrument CTs are 0.5% or less. For example, a competitive product within the <$200 category by smart-MAIC utilizes 0.5% CTs. Perhaps this is the source of deviation from the utility recorded values.
Thanks for that John!
I was struck by the discrepancy between the utility meter and the two other monitoring devices. Made me wonder as to the calibration of the current sensors. I think you explained it.
Thanks to Allison for gathering some very interesting data. The big take away for me was that even in GA the heating load swamps the AC load. I assume that this includes what ever dehumidification that the system provides. Plotting the heat pumps against recorded dew point or RH would be interesting but I don’t know that the monitoring is sufficiently granular or accurate enough to make that distinction.
Thanks again
John: Interesting. I hadn’t heard of the smart-MAIC before now. Yeah, 0.5% would definitely be better than 2% but realistically, I think 2% is fine for what I’m doing.
Wow, EUI of 17 kBTU/sf/yr is great! Here in central Indiana, my EUI last year was ~38 kBTU/sf/yr, and I thought my renovation was efficient! For comparison, my HDDs for the same period were 46.75 HDD
sorry…4,675 HDD
Very interesting article, especially since we have a 2400 sq ft home in northern AZ (at 4000 ft) and all-electric annual energy consumption of about 11 MWh…very similar to yours. It does make me feel that we, and the original builders back in 1987, have done some things right around here. The original owners used 2×6 exterior walls with conventional fiberglass batts and Andersen double-pane casement and fixed-glass windows, which were a good start. I’ve added 1/4″ acrylic panels with automotive-rubber-bulb friction fit seals for improved sound and thermal performance, upgraded plumbing fixtures and electrical stuff, converted the old electric water heater to a Rheem heat pump, changed our distant Master Bath and Guest Bath to sophisticated Stiebel Eltron tankless water heaters, upgraded the old whole-house heat pump to a fairly efficient multi-speed unit with variable-speed air handler and a soft-start circuit, as well as some aesthetic upgrades such as a couple of triple-pane skylights for the living room. Unfortunately, it is slab-on-grade so the air handler and duct work are in the attic and the uninsulated water lines are buried under the slab, making a demand-push water recirculator (vs. the timer-driven one installed) and blown-in insulation over the attic ducts on the agenda. A 6.5 kW solar panel system supplies us with about 90% of the power that we use, but the utility does not do Net metering; instead, we pay variable TOU rates, and they pay us a modest fixed rate for power fed to the grid (even when in push-pull mode with their supply and our uses), so our bill is only reduced by about 2/3 on an annual basis. A Sense whole-house power monitoring system was installed with our solar panels in 2021, so it is easy for me to see what is happening in real time, and sometimes how changes I make influence the consumption. Our water heater devices have almost paid for themselves, but I expect to move up to even higher efficiency when the Rheem unit must be replaced. With a new generation of heat pump refrigerants coming in the next few years, we’re hoping to again boost the efficiency of the house heating and cooling. And then we’ll watch the results, just like you’re doing!
Have you heard of anyone “recovering” the chilled air output from a HP water heater?
I have heard of that Steve. Some makers have duct kit connections so you can deliver the air to a specific area. But one issue is that you may not want cool air delivered to that space in the winter, so you may have to rig up a diverting damper to deliver that cool air to another area for part of the year.
I’ve seen heat pump hot water heaters that were ducted to function as some chilling and dehumidification. Back in about 2013 at one of the DOE Solar Decathlons in Irving California. Several of the teams had used the GE GEOSPRING heat pump with an “optional” duct kit that allowed air to be brought in from outside the “closet’ and returned elsewhere. Typically the students would put the heatpump and ducting in same room with ERV.
We have a semi-conditioned area where our HPWH is located, and plan to move it to the garage and seal off that connection with a door. Living in Arizona, we benefit from using the heat available in the space for water heating, plus cooling the space for other purposes. No need to duct it elsewhere, although I do plan to install a “high intake” duct when I move it to the garage, to get maximum heat input before spreading the cooler air into the garage in general, and I will also seal off the otherwise semi-conditioned space for use as my hobby area (model trains, that is). Keeping the adjacent occupied areas from being exposed to excess heat (vs. the desired in-house temperature), even with insulated walls, is a good thing where we live.
Don’t know how I ever signed up 4 your weekly B.S. but I’ve enjoyed it. Retired now. 70yrs old. & Started in remodeling when I was 14. But of course, I’ve done quite Abit of Everything in my life. My question IS- aren’t u ever concerned with ‘having all your eggs in 1 basket’? ALL Elec. ? Grid goes down- where does that leave you?
JD Roback
I currently live in the s.w. outskirts of Las Vegas. Depending partly on grid & propane & have minimal solar & prepared with firewood options. But quite far from a serious ‘survivalist’. But at my age, I really just look at the Big Picture with the healthiest time I have left.
I’m really intrigued by the 2707kWh energy use in the “everything else”.
That would typically be lighting loads, (LEDs right), ceiling fans, range hoods, bathroom fans, perhaps heated bathroom floor, TV, stereo…
Years ago when my wife and I cataloged and traced down all the loads, we went as far as counting GFCI (about 0.5W for some), smart light switches (sometimes 0.25 – 0.5W for them), but the big swinger was the coffee pot. Clear glass pot, that we’d brew coffee in the morning and keep warm until about noon. That was somewhere between a 250W and 300W load continuously… the boiling element is the same as the warming element.. just cycling more).
Outdoor landscaping… some of the highlights are 7W each… if they are incandescent.
Allison, I assume this is just you and your wife at home? I use almost 2x more electricity then you and my home is all electric. I use around 22k kw each year. That will change this year as in Feb we installed a Daikin Fit inverter HP 2.5 ton. The unit is oversized but they refused to install a 2 ton in place of a 3 ton. Good thing is that its not actually 2.5 tons as the BTU rating is 27k-28k BTU output for cooling I believe.
Anyways, my electric bill has flatlined since putting in the HP. Aside from this month we have used almost exactly 1270KW every month since Feb. That is with a house full, 2 adults, 2 kids, pets and a 50 gallon fish tank. I actually do monitor the fish tank with the emporia outlets. It uses between 35-60KW per month. I run one or 2 air pumps, a planted tank LED light that can dim, hang on back filter and a heater. Heater consumes 180 watts but its by far the most as the light as filters only consume around 35 watts.
I guess my power consumptions its all that high when you take into account we do not conserve power by going to extremes. I would like to get a HPWH and new windows though. I need to finish my rim joist insulation also.
Allison,
I was perusing your site for insight into upgrades for my existing HVAC system. We have a small “cabin” in the woods of north GA and have had issues with economical heating in the winter.
I installed the Emporia Vue to monitor the HVAC (and 14 other loads). One thing that you may not have noticed is you can adjust the multiplier of individual circuit voltages to get a more accurate wattage reading from the CT’s.
I took actual amperage and voltage readings on the circuits and adjusted them accordingly. I know it’s not really necessary to have precise readings but why not.
Anyway, if you feel the water heaters are correct you could adjust the Emporia circuits to more closely match them.