What Percent of Time Do You Spend Indoors?
Back in 2004, as I was immersing myself in the world of building science and green building, I took the US Green Building Council’s exam to become a LEED Accredited Professional. I bought their book. I took a study course at Southface to prepare for the test. And that’s when I learned a statistic that has haunted me ever since.
A haunting statistic
From the study guide, I learned that we humans spend, on average, about 90% of our time in buildings. I couldn’t believe it at first. Then I started thinking about my days and how I spend them. A third of my time in bed. Most meals indoors. A lot of time sitting at desks, watching movies, showering…
I reluctantly had to admit that I probably did spend close to 90% of my time indoors. But that’s not all. That doesn’t mean all the rest of the time is outdoors. Nope. We also spend quite a bit of time in vehicles of one sort or another.
That statistic has stuck with me all these years. I’ve occasionally wondered about the research behind it but not enough to go look up the source. At this year’s Building Science Summer Camp, however, it was given to us by Dr. Brett Singer in his talk on indoor air quality.
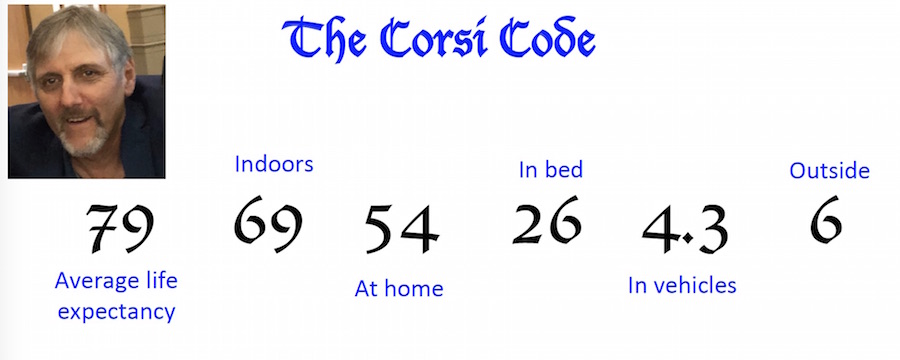
Singer’s first slide after the title was the one on the Corsi Code, which you see above. Dr. Richard Corsi is an indoor air researcher who’s done a lot of good work and apparently shows that statistic in a slightly different way. Rather than put it in percentages, he put everything in years based on the average life span of someone in the US (79).
The source of those data
The Corsi Code isn’t where the data came from, but Dr. Singer did give the source on that same slide. At the bottom of the slide, Singer showed that the percentages were based on an academic paper: Klepeis et al., J Exp Anal Env Epid 2001, 11, 231. (If you don’t read academicese, the translation of that apparent gibberish is that the first author’s last name is Klepeis and the article was in the Journal of Exposure Analysis and Environmental Epidemiology. It was published in the year 2001, volume 11, and the article begins on page 231.)
So I looked it up. It’s an interesting paper about a study called the National Human Activity Pattern Survey funded by the US Environmental Protection Agency. They phoned a lot of people all over the country over a two-year period from 1992 to 1994 and asked about how they spent their time.
Here’s a transcript of one of the interviews:
Researcher: Hey, what’re you doing right now?
Subject: I’m in the bathtub. Leave me alone.
Researcher: This won’t take long. What were you doing before you got into the bathtub?
Subject: I was mowing the lawn.
Researcher: What will you do when you get out of the tub?
Subject: I think I’m going to go make a grilled cheese sandwich and watch In Living Color.
Researcher: I love that show! Mind if I come over and watch it with you?
Subject: [Click]
Just kidding. These were professionals, not a bunch of wastrels who couldn’t hold down a regular telemarketing job. Actually, I don’t know anything about the people who made those phone calls, but according to the paper, they conducted telephone 9,386 interviews to gather the data. They would call once every three months. Afterward, the researchers analyzed the data.
How we spend our time
Here’s the pie chart showing the big picture of how the people in the study spent their time.
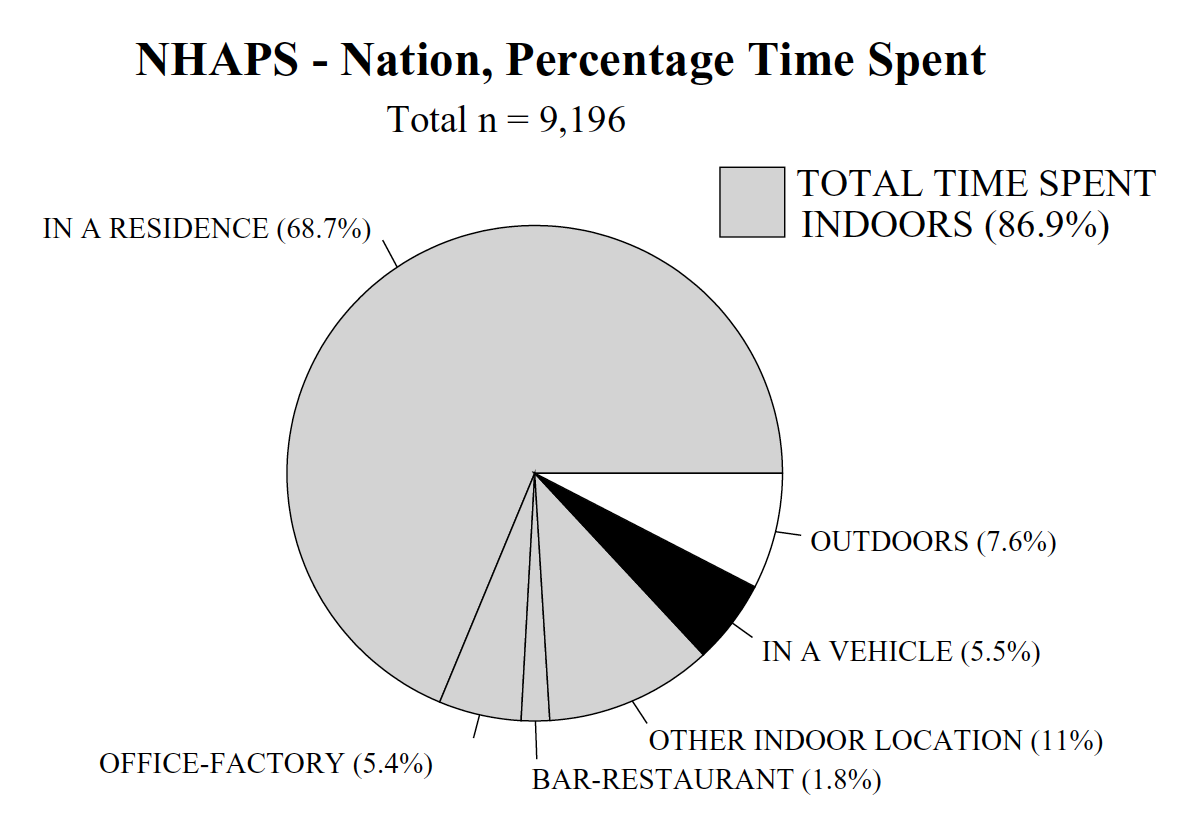
As you can see, it’s pretty depressing. We spend only about 7.6% of our time outdoors. That’s the 6 years in the Corsi Code at the top of this article. We spend two-thirds of our time at home and 5.5% in vehicles.
Of course, this is an average of thousands of people. Construction workers and professional golfers obviously would spend a higher percentage of their time outdoors, which means the numbers are probably a bit worse than they look here for people who don’t work outdoors.
The reason it’s important to know this is because our exposure to various types of air contaminants depends on what type of air we’re breathing. And since it turns out that we spend almost all of our time indoors, and two-thirds of it in our homes, it’s a good idea to pay attention the quality of that indoor air.

Meanwhile, I’m going to keep trying to get as much time outdoors as I can. That’s me on top of Grandfather Mountain in North Carolina earlier this month.
Read the study: The National Human Activity Pattern Survey (NHAPS): a resource for assessing exposure to environmental pollutants. (You can also download a pdf copy from that page.)
Related Articles
An Update on the Residential Ventilation Debate
The 2018 Building Science Summer Camp in Photos
4 Ways a Bad Duct System Can Lead to Poor Indoor Air Quality
NOTE: Comments are moderated. Your comment will not appear below until approved.
This Post Has 14 Comments
Comments are closed.
Something seems wrong with
Something seems wrong with the numbers. A “typical” working person works 40 hours/week and 50 weeks/year, so that is 2000 hours/year out of 8760 total hours per year. This means that about 23% of a working person’s time is at work. The pie chart shows 5%. Are there that many non-working people to bring that number down?
Roy, I agree that number
Roy, I agree that number seems a bit low. I couldn’t find an explanation for it in the paper after a brief search but not everyone who goes to work is in an office or factory. Some of those people spend their workday in trucks and other people’s homes, fixing air conditioners, installing carpet, painting walls, or other service jobs.
You also have to count
You also have to count children and retirees. For the first 20 years, and the last 0-50 years (depending on retirement age and lifespan), we’re inside a lot without being at work. And we also (always) miscount stay-at-home parents who are “at work” 24 hours a day, but are probably counted in the study as “at home”. Together, these groups could certainly bring down that 23% number by quite a bit.
In addition to a lot of work
In addition to a lot of work being performed outside an office or a factory, if you look at let’s say 80 years of life, most people only work around 43 years (e.g. from 22 to 65) which is 53 % of their time. So that 23 % would based on that alone drop to around 12 % for somebody that holds an office job for 43 years. Plus usually in those type of jobs after years you have more than 2 weeks of vacation, sick time, holidays, maybe periods of unemployment, etc. … so I can see how the number will shrink even further based on that.
Yes, those are good points.
Yes, those are good points. Since I have spent the last 40 years in offices, I forget about the previous 20 as a kid and the next 20 as a possible retiree. This shows how averages can lead to confusion about real individual cases.
Yea, too bad there are no
Yea, too bad there are no reasonably-priced, fairly accurate, complete-coverage IAQ monitors for the general public to purchase (or IAQ device pundits/salespeople to base their recommendations). Good thing the Federal government has an agency that gives everyone (who wants it) readings on outdoor air quality. But even that readily-obtained data still has not swayed the generally-accepted position that outdoor air is better quality than indoor air (e.g., we regularly have ozone alerts where I live).
I have been using AirThings
I have been using AirThings Pro Radon Detectors for a couple of years and really like the simplicity of device. AirThings is introducing a new device called the Wave Plus (https://airthings.com/us/wave-plus/) that measures IAQ + radon. This is supposed to be a device for everyone that has a phone app and web dashboard for tracking. The devices are set to start shipping in September and I look forward to trying it out.
I think the $269 for a
I think the $269 for a monitor that does not monitor any particulate material (of any size)m ozone or CO is a non-starter; too costly, doesn’t measure enough “stuff”, doesn’t set off any mitigation devices. I have a very good digital temp/relative humidity gauge I got off Amazon for $8. If it isn’t under $100 it will not be accepted by the main market. If it doesn’t start up some kind of remediation device or at least set off an alarm it is not providing much value.
Nate Adams (Ohio) had a very good review a couple years ago of a number of devices with an interesting testing methodology: http://energysmartohio.com/indoor-air-quality/which-indoor-air-quality-monitors-are-best-and-why/
The other side of this “coin” is what do you do about it? My understanding is that the only real device that removes PM2.5 is a HEPA filter so your IAQ system would need one of these at every air return port. How many HVAC/ERV/HRV systems have just 1 HEPA filter (let alone 1 for each return port)? How many home owners replace them each month (this is where the monitoring device comes in)?
You don’t need a HEPA filter
You don’t need a HEPA filter to removed PM2.5. HEPA filters are for particle sizes down to 0.3 microns and are overkill for PM2.5. For 2.5 micron particles, you need MERV 8 or higher.
From what I see, only MERV 11
From what I see, only MERV 11 and greater filters work for PM2.5, See the chart here: http://www.ontimeairfilters.com/air-filter-merv-rating. Notice that MERV 13+ filters (HEPA range) are used at filtering bacteria, tobacco smoke and sneeze contaminates but this firm doesn’t recommend them for HVAC systems as it may negatively affect them (i.e., they’re not made to really clean the air, just “sorta clean” the air).
David, the chart on that
David, the chart on that website has been modified by the manufacturer to suit their purposes. If you go to ASHRAE Std. 52.2 where MERV is officially defined, it shows that MERV 8 filters must have a particle removal efficiency of at least 20% for particles in the 1 to 3 micron range. That’s not a very high efficiency, but it will remove some PM2.5. Filters in the MERV 13-16 are not HEPA range. MERV 16 filters have removal efficiencies of 95% or more for particles from 0.3 to 10 microns, but HEPA filters must have a particle removal efficiency of 99.97% or above for particle larger than 0.3 microns. There is no MERV equivalent for HEPA performance, in fact, those are two different rating systems. As far as MERV 13+ filters “negatively affecting” equipment, I see no basis for that unless they are assuming that the pressure drop is higher and will thus reduce airflow rates in the system. However, filter pressure drop is not inherently related to the MERV value, in fact, I have seen higher MERV rated filters with lower pressure drops. It just depends on the overall filter design. Apparently, this company does not have high MERV filters with reasonable pressure drops available.
Roy – all good info but my
Roy – all good info but my point still stands: if you (the average homeowner) are not constantly measuring what constitutes good (or bad) IAQ you really don’t know if you have a problem, nor what the real problem might be, nor if you solved the problem after you implement a solution. And the average homeowner will not implement a high-cost measurement device. So any deployed “one-size-fits-all” solutions are just not-real-educated guesswork.
Can someone provide a link or
Can someone provide a link or some info on what good IAQ really is. I often see articles and hear folks selling IAQ products, but rarely see anyone talking about what we should be trying to achieve for IAQ. %RH levels, CO2 levels etc. I would also add full spectrum natural light levels as well considering the benefits of UV and infrared light as it impacts IAQ. Are these low-E windows impacting our IAQ?
See the next installment of
See the next installment of Allison’s blog for more discussion on “What is bad”. Also see what the US EPA considers in their (outdoor) Air Quality Index: https://airnow.gov/index.cfm?action=aqibasics.aqi.